
15.03.2024
11 хв
1903

Основи криміналістичної методики, також відомої як цифрова або комп’ютерна криміналістика, об’єднують принципи і методи виявлення, збору, збереження, аналізу та докладного звітування про цифрові докази, отримані з комп’ютерів, мережевого обладнання, і цифрових носіїв інформації, що може бути використано в судовому процесі. Цей напрямок криміналістики зростає у важливості з розвитком технологій і збільшенням кількості кіберзлочинів.

Volatility — це основна платформа з відкритим кодом для аналізу дампа пам’яті . Цей інструмент Python аналізує дампи із зовнішніх джерел або віртуальних машин VMware, ідентифікуючи такі дані, як процеси та паролі, на основі профілю ОС дампа. Він розширюється за допомогою плагінів, що робить його надзвичайно універсальним для судових розслідувань.
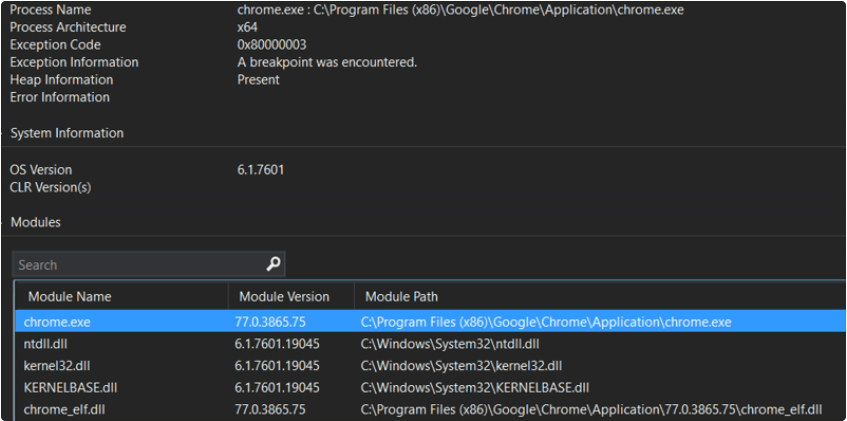
Якщо дамп невеликий (лише кілька КБ, можливо, кілька МБ), то це, ймовірно, звіт про аварійне завершення роботи міні-дампа, а не дамп пам’яті.
![]()
Якщо у вас інстальовано Visual Studio, ви можете відкрити цей файл і прив’язати деяку основну інформацію, як-от назву процесу, архітектуру, інформацію про винятки та модулі, що виконуються:
Ви також можете завантажити виняток і переглянути декомпільовані інструкції
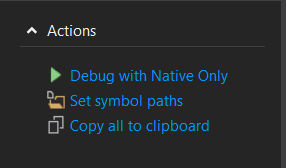
У будь-якому разі Visual Studio — не найкращий інструмент для аналізу глибини дампа. Ви повинні відкрити його за допомогою IDA або Radare , щоб детально перевірити його .
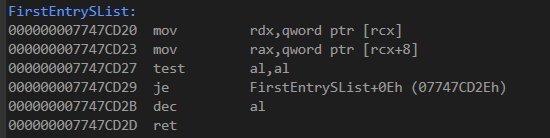
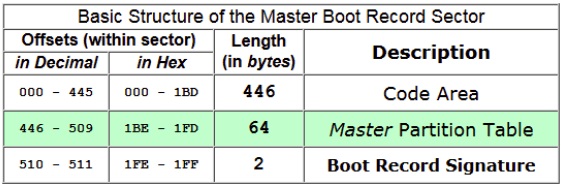
Жорсткий диск або SSD-диск можуть містити різні розділи з метою фізичного розділення даних. Мінімальною одиницею диска є сектор (зазвичай складається з 512 B). Отже, розмір кожного розділу має бути кратним цьому розміру.
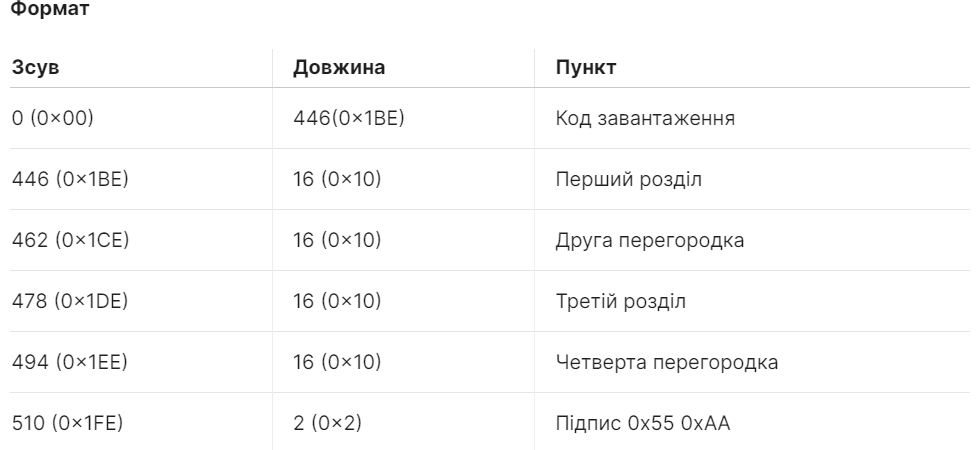
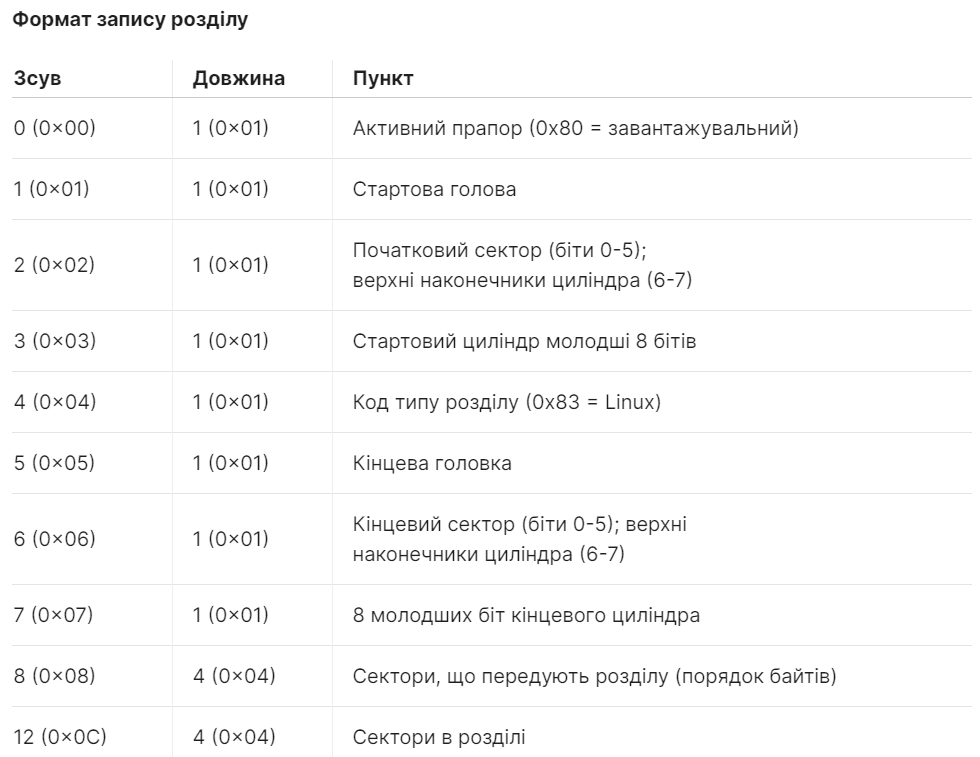
Він розміщений у першому секторі диска після 446B коду завантаження . Цей сектор важливий для того, щоб вказати комп’ютеру, що і звідки потрібно монтувати розділ. Він дозволяє створити до 4 розділів (щонайбільше лише 1 може бути активним/ завантажувальним ). Однак, якщо вам потрібно більше розділів, ви можете використовувати розширені розділи . Останнім байтом цього першого сектора є сигнатура завантажувального запису 0x55AA . Тільки один розділ можна позначити як активний. MBR дозволяє максимум 2,2 ТБ .
Від 440 до 443 байтів MBR ви можете знайти Windows Disk Signature (якщо використовується Windows). Літера логічного диска жорсткого диска залежить від підпису диска Windows. Зміна цього підпису може перешкодити завантаженню Windows (інструмент: Active Disk Editor ) .
Щоб змонтувати MBR у Linux, вам спершу потрібно отримати початкове зміщення (ви можете використати команду fdiskта p)
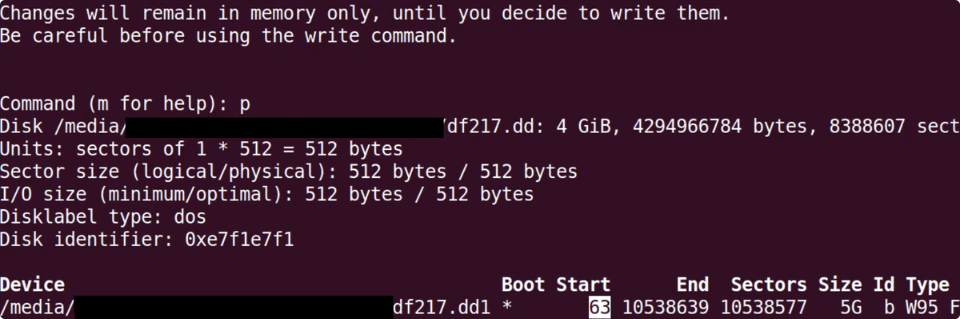
А потім використовуйте наступний код
#Mount MBR in Linux
mount -o ro,loop,offset=<Bytes>
#63x512 = 32256Bytes
mount -o ro,loop,offset=32256,noatime /path/to/image.dd /media/part/
LBA (адресація логічних блоків)
Адресація логічних блоків ( LBA ) — це звичайна схема, яка використовується для визначення розташування блоків даних, що зберігаються на комп’ютерних запам’ятовуючих пристроях, як правило, у вторинних системах зберігання, таких як жорсткі диски. LBA є особливо простою лінійною схемою адресації; блоки розташовані за цілим індексом , причому перший блок має LBA 0, другий LBA 1 і так далі.
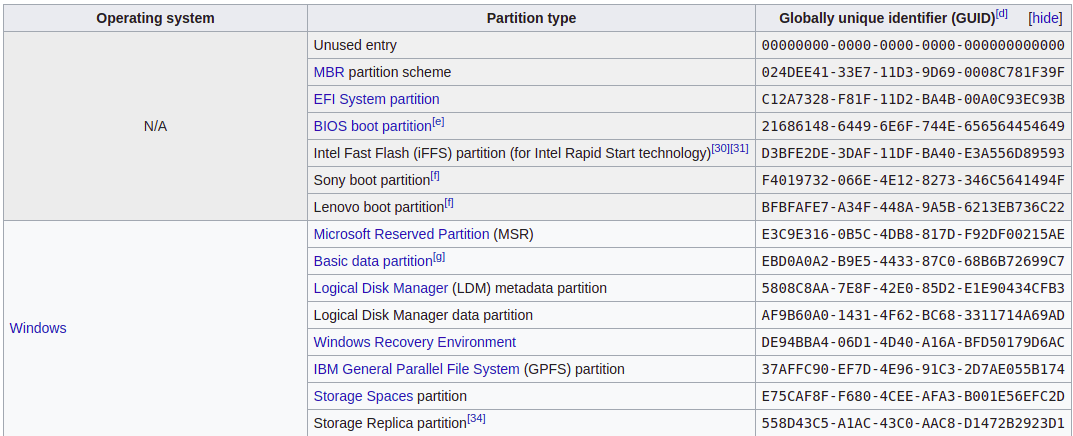
Таблиця розділів GUID, відома як GPT, користується перевагою за її розширені можливості порівняно з MBR (головний завантажувальний запис). Відрізняючись унікальним глобальним ідентифікатором для розділів, GPT виділяється кількома способами:
Розташування та розмір : і GPT, і MBR починаються з сектора 0 . Однак GPT працює на 64 бітах , на відміну від 32 біт MBR.
Обмеження розділів : GPT підтримує до 128 розділів у системах Windows і вміщує до 9,4 ZB даних.
Імена розділів : пропонує можливість називати розділи до 36 символів Unicode.
Стійкість даних і відновлення:
Надмірність : на відміну від MBR, GPT не обмежує розділення та дані завантаження в одному місці. Він відтворює ці дані на диску, підвищуючи цілісність і стійкість даних.
Перевірка циклічної надлишковості (CRC) : GPT використовує CRC для забезпечення цілісності даних. Він активно стежить за пошкодженням даних, і в разі виявлення GPT намагається відновити пошкоджені дані з іншого місця на диску.
Захисний MBR (LBA0):
GPT підтримує зворотну сумісність через захисну MBR. Ця функція міститься в застарілому просторі MBR, але призначена для запобігання старішим утилітам на основі MBR від помилкового перезапису дисків GPT, таким чином захищаючи цілісність даних на дисках у форматі GPT.
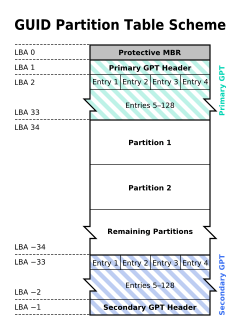
Гібридний MBR (LBA 0 + GPT) З Вікіпедії
В операційних системах, які підтримують завантаження на основі GPT через служби BIOS, а не EFI, перший сектор також може використовуватися для зберігання першого етапу коду завантажувача , але змінений для розпізнавання розділів GPT . Завантажувач у MBR не повинен передбачати розмір сектора 512 байт.
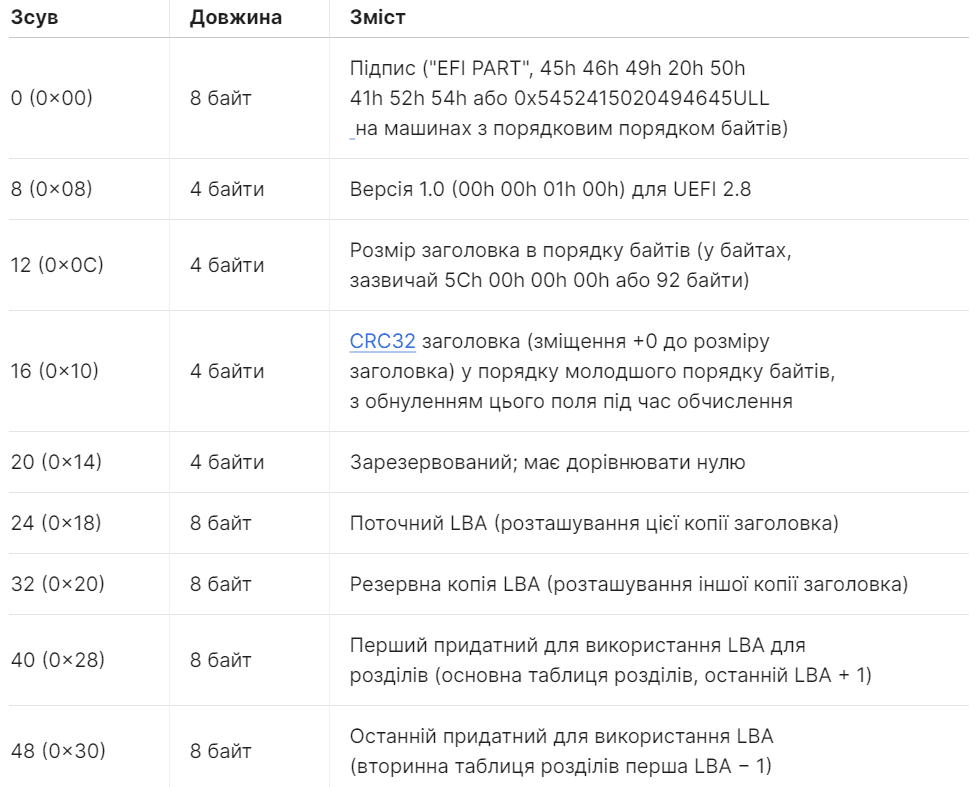
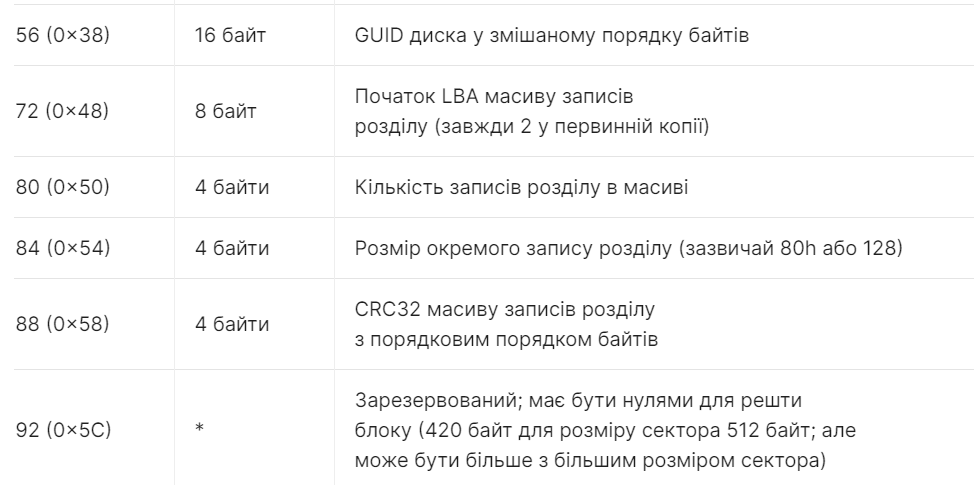
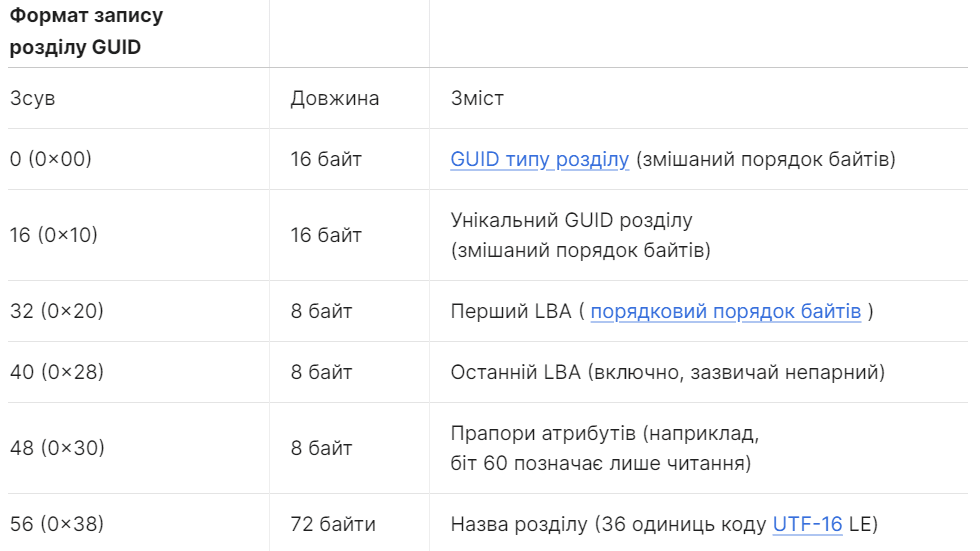
Заголовок таблиці розділів (LBA 1) З Вікіпедії
Заголовок таблиці розділів визначає придатні для використання блоки на диску. Він також визначає кількість і розмір записів розділів, які складають таблицю розділів (зміщення 80 і 84 у таблиці).
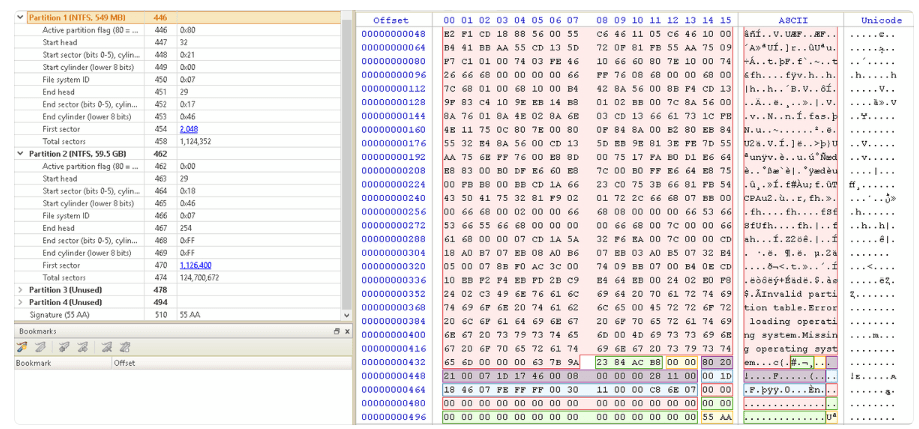
Після монтування криміналістичного образу за допомогою ArsenalImageMounter ви можете перевірити перший сектор за допомогою інструмента Windows Active Disk Editor . На наступному зображенні MBR виявлено в секторі 0 та інтерпретовано:
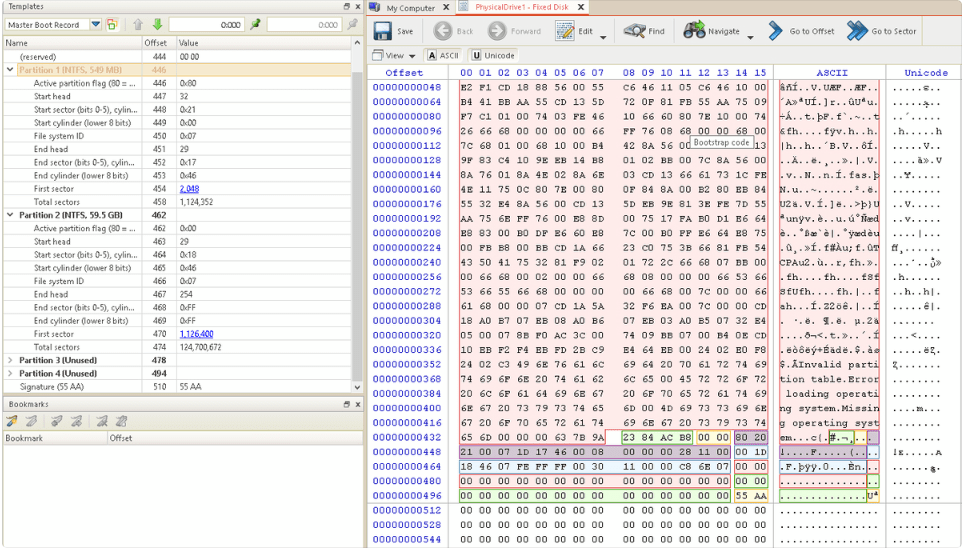
Якщо це була таблиця GPT, а не MBR, у секторі 1 (який на попередньому зображенні порожній) має з’явитися підпис EFI PART.
FAT12/16 : MSDOS, WIN95/98/NT/200
FAT32 : 95/2000/XP/2003/VISTA/7/8/10
ExFAT : 2008/2012/2016/VISTA/7/8/10
NTFS : XP/2003/2008/2012/VISTA/7/8/10
ReFS : 2012/2016
Файлова система FAT (Таблиця розміщення файлів) розроблена навколо свого основного компонента, таблиці розміщення файлів, яка розташована на початку тому. Ця система захищає дані, зберігаючи дві копії таблиці, забезпечуючи цілісність даних, навіть якщо одна з них пошкоджена. Таблиця разом із кореневою папкою має бути у фіксованому місці , що має вирішальне значення для процесу запуску системи.
Основною одиницею зберігання файлової системи є кластер, зазвичай 512B , що складається з кількох секторів. FAT розвивався через версії:
FAT12 , що підтримує 12-розрядні адреси кластерів і обслуговує до 4078 кластерів (4084 з UNIX).
FAT16 , розширена до 16-розрядних адрес, таким чином вміщуючи до 65 517 кластерів.
FAT32 , що продовжує розвиватися з 32-розрядними адресами, дозволяючи вражаючі 268 435 456 кластерів на том.
Значним обмеженням для версій FAT є максимальний розмір файлу 4 ГБ , який накладається 32-бітним полем, яке використовується для зберігання розміру файлу.
Ключові компоненти кореневого каталогу, зокрема для FAT12 і FAT16, включають:
Назва файлу/папки (до 8 символів)
Атрибути
Дати створення, модифікації та останнього доступу
Адреса таблиці FAT (вказує початковий кластер файлу)
Розмір файлу
Ext2 є найпоширенішою файловою системою для розділів без журналювання ( розділів, які не сильно змінюються ), як-от завантажувальний розділ. Ext3/4 ведуть журнал і зазвичай використовуються для решти розділів .
Деякі файли містять метадані. Ця інформація стосується вмісту файлу, який інколи може бути цікавим для аналітика, оскільки залежно від типу файлу він може містити таку інформацію:
Назва
Використана версія MS Office
Автор
Дати створення та останньої модифікації
Модель камери
GPS координати
Інформація про зображення
Ви можете використовувати такі інструменти, як exiftool і Metadiver , щоб отримати метадані файлу.
Як було показано раніше, є кілька місць, де файл все ще зберігається після того, як його було “видалено”. Це тому, що зазвичай видалення файлу з файлової системи просто позначає його як видалений, але дані не торкаються. Потім можна перевірити реєстри файлів (наприклад, MFT) і знайти видалені файли.
Крім того, ОС зазвичай зберігає багато інформації про зміни файлової системи та резервні копії, тому можна спробувати використати їх для відновлення файлу або якомога більшої кількості інформації.
Розрізання файлів — це техніка, яка намагається знайти файли в масі даних . Існує 3 основних способи роботи таких інструментів: на основі заголовків і нижніх колонтитулів типів файлів , на основі структур типів файлів і на основі самого вмісту .
Зауважте, що ця методика не працює для отримання фрагментованих файлів . Якщо файл не зберігається в суміжних секторах , ця техніка не зможе знайти його або принаймні його частину.
Є кілька інструментів, які можна використовувати для різьблення файлів із зазначенням типів файлів, які потрібно шукати.
Data Stream Carving схожий на File Carving, але замість повних файлів шукає цікаві фрагменти інформації. Наприклад, замість пошуку повного файлу, що містить зареєстровані URL-адреси, ця техніка шукатиме URL-адреси.
Очевидно, існують способи «безпечного» видалення файлів і частини журналів про них . Наприклад, можна кілька разів перезаписати вміст файлу небажаними даними, а потім видалити журнали з $MFT і $LOGFILE про файл і видалити тіньові копії томів . Ви можете помітити, що навіть під час виконання цієї дії можуть існувати інші частини, де існування файлу все ще реєструється , і це правда, і частиною професійної роботи криміналістів є їх пошук.
Якщо заголовок вашого pcap зламано , спробуйте виправити це за допомогою: http://f00l.de/hacking/ pcapfix.php
Видобувайте інформацію та шукайте зловмисне програмне забезпечення всередині pcap у PacketTotal
Шукайте шкідливі дії за допомогою www.virustotal.com і www.hybrid-analysis.com
Наступні інструменти корисні для отримання статистики, файлів тощо.
Xplico (лише для Linux) може аналізувати pcapі отримувати з нього інформацію. Наприклад, із файлу pcap Xplico витягує кожну електронну пошту (протоколи POP, IMAP і SMTP), увесь вміст HTTP, кожен виклик VoIP (SIP), FTP, TFTP тощо.
встановити
sudo bash -c 'echo "deb http://repo.xplico.org/ $(lsb_release -s -c) main" /etc/apt/sources.list'
sudo apt-key adv --keyserver keyserver.ubuntu.com --recv-keys 791C25CE
sudo apt-get update
sudo apt-get install xplico
бігти
/etc/init.d/apache2 restart
/etc/init.d/xplico start
Доступ до 127.0.0.1:9876 з обліковими даними xplico:xplico
Потім створіть новий кейс , створіть новий сеанс у ньому та завантажте файл pcap .
Як і Xplico, це інструмент для аналізу та вилучення об’єктів із pcaps . Він має безкоштовну версію, яку ви можете завантажити тут . Він працює з Windows . Цей інструмент також корисний для аналізу іншої інформації з пакетів, щоб мати змогу швидше знати, що відбувається .
Ви можете завантажити NetWitness Investigator тут (працює в Windows) . Це ще один корисний інструмент, який аналізує пакети та сортує інформацію таким чином, щоб знати, що відбувається всередині .
Вилучення та кодування імен користувачів і паролів (HTTP, FTP, Telnet, IMAP, SMTP…)
Витягніть хеші автентифікації та зламайте їх за допомогою Hashcat (Kerberos, NTLM, CRAM-MD5, HTTP-Digest…)
Створення візуальної діаграми мережі (вузли та користувачі мережі)
Витягти DNS-запити
Реконструювати всі сеанси TCP і UDP
Напилок для різьблення
capinfos capture.pcap
Якщо ви шукаєте щось всередині pcap, ви можете скористатися ngrep . Ось приклад використання основних фільтрів:
ngrep -I packets.pcap "^GET" "port 80 and tcp and host 192.168 and dst host 192.168 and src host 192.168"
Встановити та налаштувати
apt-get install suricata
apt-get install oinkmaster
echo "url = http://rules.emergingthreats.net/open/suricata/emerging.rules.tar.gz" >> /etc/oinkmaster.conf
oinkmaster -C /etc/oinkmaster.conf -o /etc/suricata/rules
Перевірте PCAP
suricata -r packets.pcap -c /etc/suricata/suricata.yaml -k none -v -l log
YaraPCAP — це інструмент, який:
Читає файл PCAP і витягує потоки Http.
gzip розкачує будь-які стиснуті потоки
Сканує кожен файл за допомогою yara
Пише звіт.txt
Додатково зберігає відповідні файли в каталог
Zeek — пасивний аналізатор мережевого трафіку з відкритим кодом. Багато операторів використовують Zeek як монітор безпеки мережі (NSM) для підтримки розслідування підозрілої або зловмисної діяльності. Zeek також підтримує широкий спектр завдань аналізу трафіку за межами сфери безпеки, включаючи вимірювання продуктивності та усунення несправностей.
Загалом журнали, створені за допомогою, zeekне є pcaps . Тому вам знадобиться використовувати інші інструменти для аналізу журналів, де міститься інформація про pcaps.
#Get info about longest connections (add "grep udp" to see only udp traffic)
#The longest connection might be of malware (constant reverse shell?)
cat conn.log | zeek-cut id.orig_h id.orig_p id.resp_h id.resp_p proto service duration | sort -nrk 7 | head -n 10

10.55.100.100   49778   65.52.108.225   443     tcp     -       86222.365445
10.55.100.107   56099   111.221.29.113  443     tcp     -       86220.126151
10.55.100.110   60168   40.77.229.82    443     tcp     -       86160.119664


#Improve the metrics by summing up the total duration time for connections that have the same destination IP and Port.
cat conn.log | zeek-cut id.orig_h id.resp_h id.resp_p proto duration | awk 'BEGIN{ FS="\t" } { arr[$1 FS $2 FS $3 FS $4] += $5 } END{ for (key in arr) printf "%s%s%s\n", key, FS, arr[key] }' | sort -nrk 5 | head -n 10

10.55.100.100   65.52.108.225   443     tcp     86222.4
10.55.100.107   111.221.29.113  443     tcp     86220.1
10.55.100.110   40.77.229.82    443     tcp     86160.1

#Get the number of connections summed up per each line
cat conn.log | zeek-cut id.orig_h id.resp_h duration | awk 'BEGIN{ FS="\t" } { arr[$1 FS $2] += $3; count[$1 FS $2] += 1 } END{ for (key in arr) printf "%s%s%s%s%s\n", key, FS, count[key], FS, arr[key] }' | sort -nrk 4 | head -n 10

10.55.100.100   65.52.108.225   1       86222.4
10.55.100.107   111.221.29.113  1       86220.1
10.55.100.110   40.77.229.82    134       86160.1

#Check if any IP is connecting to 1.1.1.1
cat conn.log | zeek-cut id.orig_h id.resp_h id.resp_p proto service | grep '1.1.1.1' | sort | uniq -c

#Get number of connections per source IP, dest IP and dest Port
cat conn.log | zeek-cut id.orig_h id.resp_h id.resp_p proto | awk 'BEGIN{ FS="\t" } { arr[$1 FS $2 FS $3 FS $4] += 1 } END{ for (key in arr) printf "%s%s%s\n", key, FS, arr[key] }' | sort -nrk 5 | head -n 10


# RITA
#Something similar can be done with the tool rita
rita show-long-connections -H --limit 10 zeek_logs

+---------------+----------------+--------------------------+----------------+
|   SOURCE IP   | DESTINATION IP | DSTPORT:PROTOCOL:SERVICE |    DURATION    |
+---------------+----------------+--------------------------+----------------+
| 10.55.100.100 | 65.52.108.225  | 443:tcp:-                | 23h57m2.3655s  |
| 10.55.100.107 | 111.221.29.113 | 443:tcp:-                | 23h57m0.1262s  |
| 10.55.100.110 | 40.77.229.82   | 443:tcp:-                | 23h56m0.1197s  |

#Get connections info from rita
rita show-beacons zeek_logs | head -n 10
Score,Source IP,Destination IP,Connections,Avg Bytes,Intvl Range,Size Range,Top Intvl,Top Size,Top Intvl Count,Top Size Count,Intvl Skew,Size Skew,Intvl Dispersion,Size Dispersion
1,192.168.88.2,165.227.88.15,108858,197,860,182,1,89,53341,108319,0,0,0,0
1,10.55.100.111,165.227.216.194,20054,92,29,52,1,52,7774,20053,0,0,0,0
0.838,10.55.200.10,205.251.194.64,210,69,29398,4,300,70,109,205,0,0,0,0
#Get info about each DNS request performed
cat dns.log | zeek-cut -c id.orig_h query qtype_name answers

#Get the number of times each domain was requested and get the top 10
cat dns.log | zeek-cut query | sort | uniq | rev | cut -d '.' -f 1-2 | rev | sort | uniq -c | sort -nr | head -n 10

#Get all the IPs
cat dns.log | zeek-cut id.orig_h query | grep 'example\.com' | cut -f 1 | sort | uniq -c

#Sort the most common DNS record request (should be A)
cat dns.log | zeek-cut qtype_name | sort | uniq -c | sort -nr

#See top DNS domain requested with rita
rita show-exploded-dns -H --limit 10 zeek_logs
In the path \Users\<username>\AppData\Local\Microsoft\Windows\Notifications, you can find the database appdb.dat (before Windows Anniversary) or wpndatabase.db (after Windows Anniversary).
In this SQLite database, you can find a Notification table with all messages (in XML format) that may contain interesting data.
Chronology
Timeline is a feature of Windows that provides a chronological history of web pages you’ve visited, documents you’ve edited, and programs you’ve run.
The database is located at \Users\<username>\AppData\Local\ConnectedDevicesPlatform\<id>\ActivitiesCache.db. This database can be opened with the SQLite tool or the WxTCmd tool, which generates 2 files that can be opened with the TimeLine Explorer tool.
ADS (Alternative Data Streams)
Downloaded files may contain an ADS Zone.Identifier that indicates how they were downloaded from an internal network, the Internet, etc. Some software (eg browsers) usually post even more information, such as the URL from where the file was downloaded.
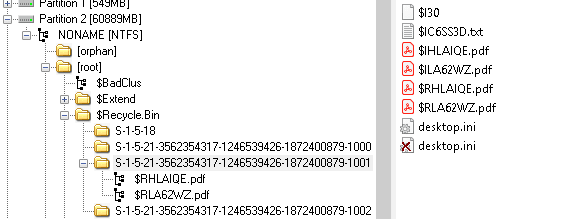
In Vista/Win7/Win8/Win10, the Recycle Bin can be found in the $Recycle.bin folder at the root of the drive ( C:\$Recycle.bin ). When a file is deleted in this folder, 2 specific files are created:
$I{id}: information about the file (the date it was deleted}
$R{id}: The contents of the file
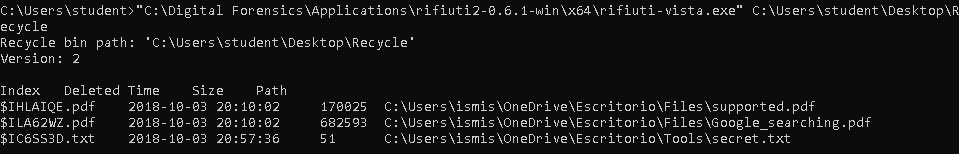
Once you have these files, you can use the Rifiuti tool to get the source address of the deleted files and the date they were deleted (use refiuti-vista.exe for Vista – Win10).
.\rifiuti-vista.exe C:\Users\student\Desktop\Recycle
Shadow Copy is a technology included in Microsoft Windows that can create backup copies or snapshots of computer files or volumes even while they are in use.
These backups are usually located in the \System Volume Information root of the file system, and the name consists of the UIDs shown in the following image:
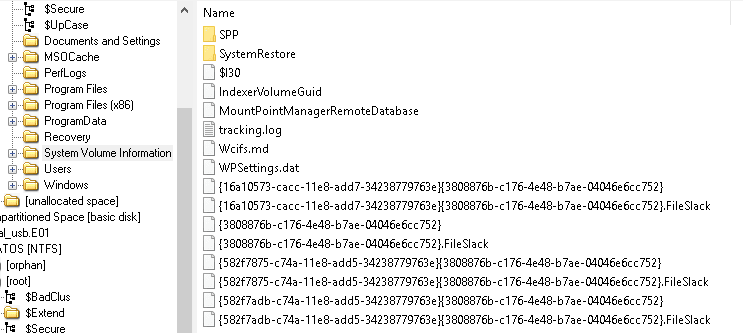
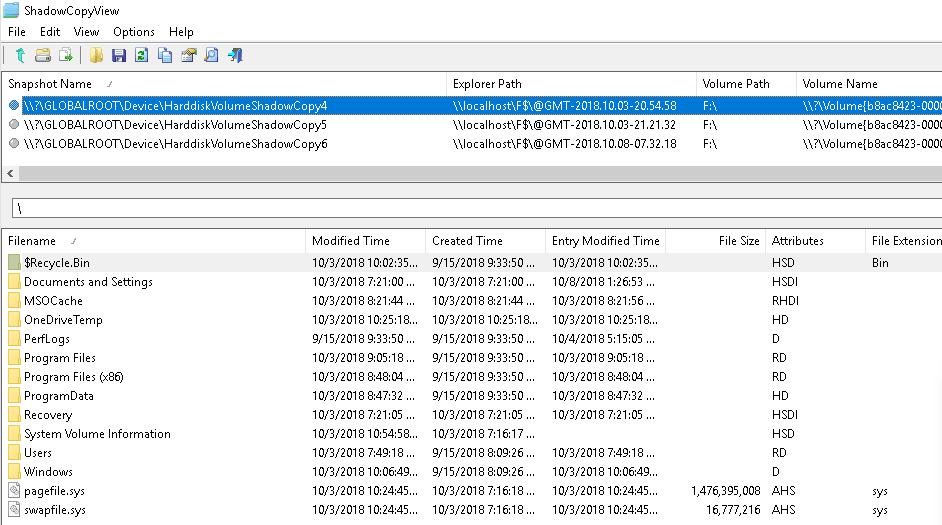
When mounting a forensic image with ArsenalImageMounter , the ShadowCopyView tool can be used to inspect the shadow copy and even extract files from shadow copy backups.
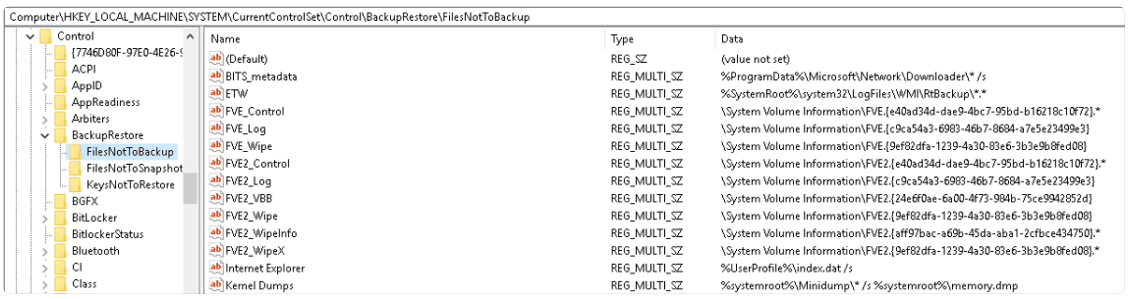
The registry entry HKEY_LOCAL_MACHINE\SYSTEM\CurrentControlSet\Control\BackupRestore contains files and keys for backup:
The HKEY_LOCAL_MACHINE\SYSTEM\CurrentControlSet\Services\VSS registry also contains information about the configuration of Volume Shadow Copies.
Autosaved office files can be found in:
C:\Usuarios\\AppData\Roaming\Microsoft{Excel|Word|Powerpoint}\
A shell element is an element that contains information about how to access another file.
Windows automatically creates these shortcuts when a user opens, uses, or creates a file in:
Win7-Win10:
C:\Users\\AppData\Roaming\Microsoft\Windows\Recent\
офіс:
C:\Users\\AppData\Roaming\Microsoft\Office\Recent\
When you create a folder, it also creates a link to the folder, the parent folder, and the grandparent folder.
These automatically generated link files contain information about the origin, such as whether it is a file or a folder, the MAC time of the file, information about the volume where the file is stored, and the destination file folder. This information may be useful in recovering these files if they have been deleted.
Also, the reference file creation date is the first time the original file was used, and the reference file modification date is the last time the original file was used. To inspect these files, you can use LinkParser . In these tools you will find 2 sets of timestamps:
First set:
FileModifiedDate
FileAccessDate
FileCreationDate
LinkModifiedDate
LinkAccessDate
LinkCreationDate.
The first set of timestamps refers to the timestamps of the file itself. The second set refers to the timestamps of the associated file.
You can get the same information by running the Windows CLI tool:LECmd.exe
LECmd.exe -d C:\Users\student\Desktop\LNKs --csv C:\Users\student\Desktop\LNKs
In this case, the information will be saved in a CSV file.
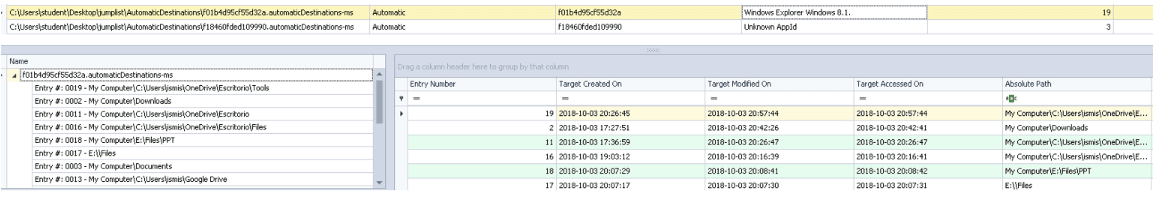
These are the last files listed for each program. This is a list of recently used files by an application that you can access in each application. They can be created automatically or be individual.
Automatically generated roaming lists are stored in C:\Users\{username}\AppData\Roaming\Microsoft\Windows\Recent\AutomaticDestinations\. Destination lists are named according to the format, {id}.autmaticDestinations-mswhere the initial id is the application ID.
Custom jump lists are stored in C:\Users\{username}\AppData\Roaming\Microsoft\Windows\Recent\CustomDestination\and are usually created by an application because something important happened to the file (perhaps marked as a favorite)
The creation time of any jump list indicates the first time the file was accessed and the time it was last modified.
You can check the jump lists with JumplistExplorer.
You can determine that a USB device was used by creating:
Windows Recent Folder
Остання папка Microsoft Office
Списки стрибків
Note that some LNK files point to the WPDNSE folder instead of the original path:
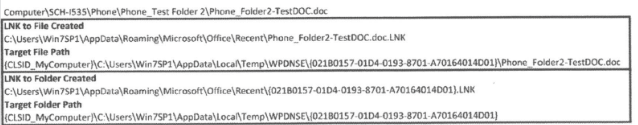
The files in the WPDNSE folder are copies of the original files, so they won’t survive a PC reboot, and the GUID is taken from the shell.
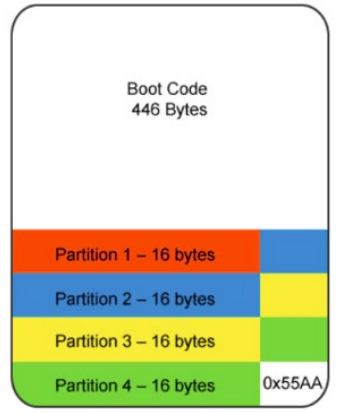
Check the C:\Windows\inf\setupapi.dev.log file for timestamps of when the USB connection was made (look for Section start).

USBDetective can be used to obtain information about USB devices connected to an image.
![]()
A scheduled task known as Plug and Play Cleanup is primarily designed to remove outdated driver versions. Contrary to its stated purpose of keeping the latest version of the driver package, online sources suggest that it also targets drivers that have been inactive for 30 days. Therefore, drivers for removable devices that have not been connected in the last 30 days may be removed.
The task is located in the following way:
C:\Windows\System32\Tasks\Microsoft\Windows\Plug and Play\Plug and Play Cleanup.
A screenshot showing the content of the task is provided:
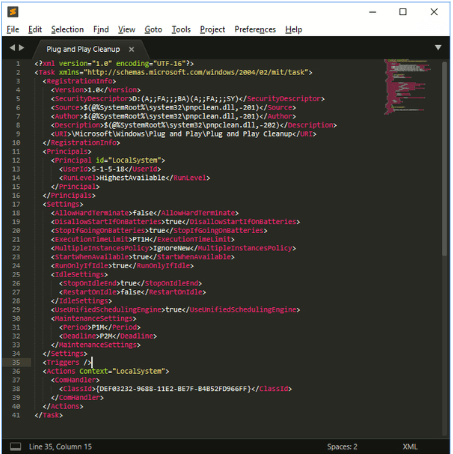
Key components and task parameters:
pnpclean.dll : This DLL is responsible for the actual cleaning process.
UseUnifiedSchedulingEngine : Set to TRUE to indicate the use of a unified task scheduling engine.
Service parameters:
Period (‘P1M’) : Tells the task scheduler to trigger a cleanup task every month during regular automatic maintenance.
Deadline (‘P2M’) : Instructs the task scheduler, if the task is not executed for two consecutive months, to execute the task during emergency automatic maintenance.
This configuration provides regular driver maintenance and cleanup with the ability to retry the task in case of consecutive failures.
Emails have 2 interesting parts: headers and email body. The following information can be found in the headers:
Who sent the emails (email address, IP, mail servers that forwarded the email)
When the email was sent
In addition, the References and In-Reply-To headers contain message identifiers:

This program saves emails in HTML or text format. You can find the emails in the \Users\<username>\AppData\Local\Comms\Unistore\data\3\ subfolders. Emails are saved with the .dat extension.
Email and contact metadata can be found in EDB :\Users\<username>\AppData\Local\Comms\UnistoreDB\store.vol
Change the file extension from .vol to .edb and you can use the ESEDatabaseView tool to open it. Inside the Message table, you can see the e-mails.
When using Exchange servers or Outlook clients, there will be some MAPI headers:
Mapi-Client-Submit-Time: The system time when the email was submitted
Mapi-Conversation-Index: The number of child messages of the stream and the timestamp of each message of the stream
Mapi-Entry-ID: Message ID.
Mappi-Message-Flags and Pr_last_Verb-Executed: MAPI client information (message read? unread? replied? forwarded? out of office?)
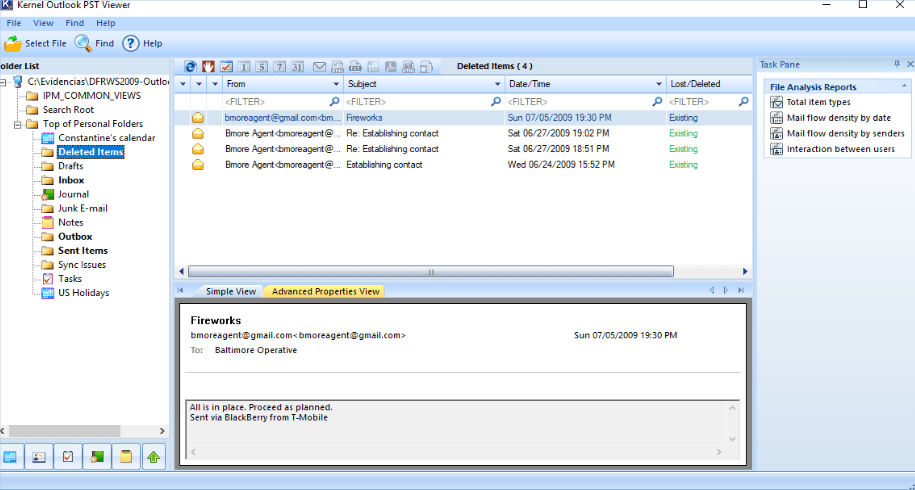
In the Microsoft Outlook client, all sent/received messages, contact data, and calendar data are stored in a PST file in:
%USERPROFILE%\Local Settings\Application Data\Microsoft\Outlook(WinXP)
%USERPROFILE%\AppData\Local\Microsoft\Outlook
The registry path specifies the file being used.
HKEY_CURRENT_USER\Software\Microsoft\WindowsNT\CurrentVersion\Windows Messaging Subsystem\Profiles\Outlook
You can open PST file using Kernel PST Viewer tool.
An OST file is created by Microsoft Outlook when configured with IMAP or an Exchange server, storing information similar to a PST file. This file syncs with the server, stores the last 12 months of data up to a maximum size of 50 GB, and is located in the same directory as the PST file. To view the OST file, you can use the OST Kernel viewer.
Lost attachments can be recovered from:
For IE10 :%APPDATA%\Local\Microsoft\Windows\Temporary Internet Files\Content.Outlook
For IE11 and above :%APPDATA%\Local\Microsoft\InetCache\Content.Outlook
Thunderbird uses MBOX files for data storage located at \Users\%USERNAME%\AppData\Roaming\Thunderbird\Profiles.
Windows XP and 8-8.1 : When accessing the thumbnails folder, a thumbs.db file is created with preview images even after deletion.
Windows 7/10 : thumbs.db is created when accessing over the network via a UNC path.
Windows Vista and later: Preview thumbnails are concentrated in %userprofile%\AppData\Local\Microsoft\Windows\Explorer files named thumbcache_xxx.db . Thumbsviewer and ThumbCache Viewer are tools for viewing these files.
The Windows registry, which stores a large amount of system and user data, is contained in files in:
%windir%\System32\Config for various HKEY_LOCAL_MACHINE subkeys.
%UserProfile%{User}\NTUSER.DAT for HKEY_CURRENT_USER.
Windows Vista and later versions back up the HKEY_LOCAL_MACHINE registry files in %Windir%\System32\Config\RegBack\.
Additionally, application execution information is stored in %UserProfile%\{User}\AppData\Local\Microsoft\Windows\USERCLASS.DATWindows Vista and Windows 2008 Server.
Some tools are useful for analyzing registry files:
Registry Editor : It is installed in Windows. This is a GUI for navigating the Windows registry of the current session.
Registry Explorer : Allows you to download a registry file and navigate through it using a graphical user interface. It also includes bookmarks that highlight keys with interesting information.
RegRipper : Again, this has a GUI that allows you to navigate through the downloaded registry, and also includes plugins that highlight interesting information inside the downloaded registry.
Windows Registry Recovery : Another GUI program capable of extracting important information from a downloaded registry.
When a key is deleted, it is marked as such, but until the space it occupies is needed, it will not be deleted. Thus, using tools like Registry Explorer, these deleted keys can be recovered.
Time of last recording
Each key-value contains a timestamp that indicates the time of the last change.
SAM
The SAM file/hive contains hashes of users, groups, and passwords of system users.
In SAM\Domains\Account\Users, you can get the username, RID, last login, last failed login, login counter, password policy, and account creation date. You also need a SYSTEM file/hive to get the hashes.
Inside the NTUSER.DAT registry in the path Software\Microsoft\Current Version\Search\RecentApps, you can place subsections with information about the running program, the time of its last execution and the number of starts.
You can open the SYSTEM file using the registry editor and inside the path SYSTEM\CurrentControlSet\Services\bam\UserSettings\{SID} you can find information about the programs run by each user (note the {SID} in the path) and the time they were run completed (the time is specified in the value of the registry data).
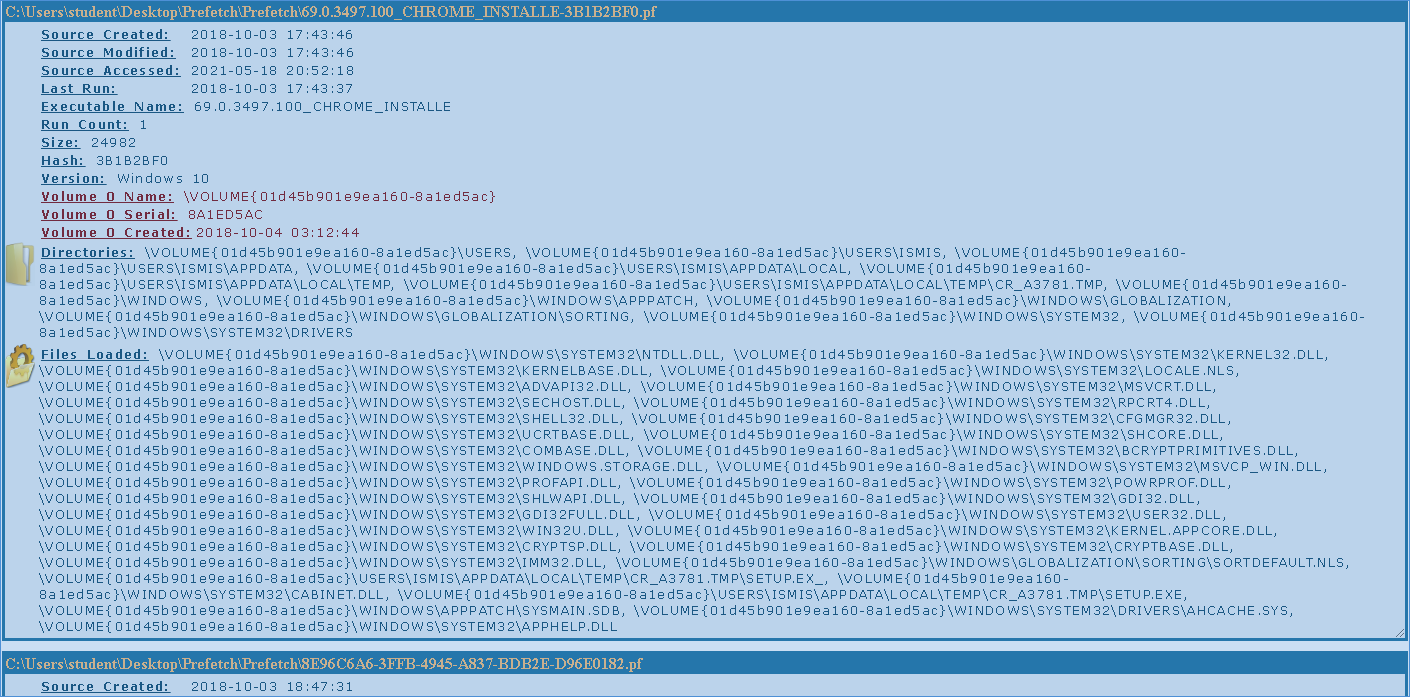
Prefetching is a technique that allows the computer to silently acquire the necessary resources needed to display content that the user may access in the near future so that resources can be accessed more quickly.
Windows prefetch is to create caches of executable programs to be able to load them faster. These caches are created as .pf files inside the path: C:\Windows\Prefetch. There is a limit of 128 files in XP/VISTA/WIN7 and 1024 files in Win8/Win10.
The file name is generated as {program_name}-{hash}.pf (the hash is based on the executable path and arguments). In W10, these files are compressed. Note that the very presence of the file indicates that the program was executed at some point.
The file C:\Windows\Prefetch\Layout.ini contains the folder names of the files that are prefetched. This file contains information about the number of runs, execution dates, and files opened by the program.
To check these files, you can use the PEcmd.exe tool:
.\PECmd.exe -d C:\Users\student\Desktop\Prefetch --html "C:\Users\student\Desktop\out_folder"
Superprefetch has the same goal as prefetch, to load apps faster by anticipating what will load next. However, it does not replace the pre-fetch service. This service will generate database files in the format C:\Windows\Prefetch\Ag*.db.
In these databases, you can find the program name, number of runs, open files, access volumes, full path, time frames, and timestamps.
You can access this information using the CrowdResponse tool.
The System Resource Usage Monitor (SRUM) monitors the resources consumed by a process. It appeared in W8 and stores data in the ESE database located at C:\Windows\System32\sru\SRUDB.dat.
It provides the following information:
AppID and path
The user who executed the process
Bytes sent
Bytes received
Network interface
Duration of connection
Duration of the process
This information is updated every 60 minutes. You can get the date from this file using the srum_dump tool.
.\srum_dump.exe -i C:\Users\student\Desktop\SRUDB.dat -t SRUM_TEMPLATE.xlsx -o C:\Users\student\Desktop\srum
AppCompatCache, also known as ShimCache, is part of the Application Compatibility Database developed by Microsoft to solve application compatibility problems. This system component records various pieces of metadata files, which include:
The full path to the file
File size
Time of last modification by $Standard_Information (SI)
The time when ShimCache was last updated
Process execution flag
Such data is stored in the registry in certain places depending on the version of the operating system:
For XP, data is stored under SYSTEM\CurrentControlSet\Control\SessionManager\Appcompatibility\AppcompatCache with a capacity of 96 entries.
For Server 2003 and Windows 2008, 2012, 2016, 7, 8, and 10, the storage path is SYSTEM\CurrentControlSet\Control\SessionManager\AppcompatCache\AppCompatCache512 and 1024 entries, respectively.
To analyze the stored information, it is recommended to use the AppCompatCacheParser tool.
The Amcache.hve file is essentially a registry hive that records information about programs that have been executed on the system. It can usually be found at C:\Windows\AppCompat\Programas\Amcache.hve.
This file is known for storing records of recently run processes, including executable file paths and their SHA1 hashes. This information is invaluable for tracking the activity of programs on the system.
You can use the AmcacheParser tool to retrieve and parse data from Amcache.hve. The following command is an example of using AmcacheParser to parse the contents of the Amcache.hve file and output the results in CSV format:
AmcacheParser.exe -f C:\Users\genericUser\Desktop\Amcache.hve --csv C:\Users\genericUser\Desktop\outputFolder
Among the generated CSV files, Amcache_Unassociated file entries deserves special attention due to the rich information it provides about unassociated files.
The most interesting CVS generated file is the Amcache_Unassociated file entries.
This artifact can only be found in W7 at C:\Windows\AppCompat\Programs\RecentFileCache.bcf and contains information about the recent execution of some binaries.
You can use the RecentFileCacheParse tool to parse the file.
Scheduled tasks
You can extract them from C:\Windows\Tasks or C:\Windows\System32\Tasks and read them as XML.
Services
You can find them in the registry at SYSTEM\ControlSet001\Services. You can see what will be done and when.
Installed applications can be found in \ProgramData\Microsoft\Windows\AppRepository\ this repository has a log of every application installed on the system in the StateRepository-Machine.srd database.
In the Application table of this database, you can find the columns: “Application ID”, “PackageNumber”, and “Display Name”. These columns contain information about pre-installed and installed programs and can be found if some programs have been uninstalled because the IDs of installed programs must be consistent.
You can also find the installed program inside the registry path: Software\Microsoft\Windows\CurrentVersion\Appx\AppxAllUserStore\Applications\ And deleted programs in:Software\Microsoft\Windows\CurrentVersion\Appx\AppxAllUserStore\Deleted\
Information displayed in Windows events:
What happened
Timestamp (UTC + 0)
Involved users
Hosts involved (hostname, IP)
Access to resources (files, folder, printer, services)
The logs are located under C:\Windows\System32\configWindows Vista and C:\Windows\System32\winevt\Logs after Windows Vista. Before Windows Vista, event logs were in binary format, and after that they were in XML format with the extension .evtx .
The location of the event files can be found in the system registry at HKLM\SYSTEM\CurrentControlSet\services\EventLog\{Application|System|Security}
They can be visualized using the Windows Event Viewer ( eventvwr.msc ) or using other tools such as Event Log Explorer or Evtx Explorer/EvtxECmd.
Access events are logged to the security configuration file located at C:\Windows\System32\winevt\Security.evtx. The size of this file can be adjusted, and when its size is reached, older events are overwritten. Logged events include user logins and logouts, user actions and changes to security settings, and access to files, folders, and shares.
Key event identifiers for user authentication:
EventID 4624 : Indicates successful user authentication.
EventID 4625 : Signals an authentication error.
Event IDs 4634/4647 : Represent user exit events.
EventID 4672 : Indicates a login with administrator rights.
Interactive (2) : direct user input.
Network (3) : Access shared folders.
Batch (4) : execution of batch processes.
Service (5) : start the service.
Proxy (6) : proxy authentication.
Unlock (7) : The screen is unlocked with a password.
Network clear text (8) : Password transmission in clear text, often from IIS.
New Credentials (9) : Use different credentials for access.
Remote Interactive (10) : Login to Remote Desktop or Terminal Services.
Cache Interactive (11) : Login with cached credentials without contacting a domain controller.
Cache Remote Interactive (12) : Remote login with cached credentials.
Cached Unlock (13) : Unlock using cached credentials.
0xC0000064 : Username does not exist – This may indicate a username enumeration attack.
0xC000006A : Valid username but incorrect password – possible password guessing or password guessing.
0xC0000234 : User account locked – can happen after a brute force attack, resulting in multiple failed logins.
0xC0000072 : Account Disabled – Unauthorized attempts to access disabled accounts.
0xC000006F : Login outside of authorized hours – indicates access attempts outside the established login hours, a possible sign of unauthorized access.
0xC0000070 : Violation of workstation restrictions – this may be an unauthorized login attempt.
0xC0000193 : Account Expiration – Access attempts with expired user accounts.
0xC0000071 : Password Expired – Login attempts with outdated passwords.
0xC0000133 : Time synchronization problems. Large discrepancies in the timing between the client and the server may indicate more sophisticated attacks such as ticket passing.
0xC0000224 : Mandatory password change required – Frequent mandatory changes may indicate an attempt to destabilize account security.
0xC0000225 : Indicates a system error, not a security issue.
0xC000015b : Forbidden login type – An access attempt with an unauthorized login type, such as a user trying to login to a service.
time modification : modifying the system time can hide the chronology of events.
System Startup and Shutdown : Event ID 6005 indicates system startup, while Event ID 6006 indicates system shutdown.
Log deletion : Security logs are cleared, which is often a sign of hidden illegal activity.
20001 / 20003 / 10000 : First USB device connection.
10100 : USB driver update.
EventID 112 : USB device connection time.
For practical examples of simulating these login types and credential reset capabilities, see in the detailed Altered Security guide.
Event details, including status and substatus codes, provide additional information about the cause of the event, particularly in Event ID 4625.
To increase the chances of recovering deleted Windows events, we recommend shutting down the suspect computer by disconnecting it from the network. Bulk_extractor , a recovery tool that specifies the .evtx extension, is recommended for trying to recover from such events.
Detecting Common Attacks Through Windows Events For a comprehensive guide to using Windows Event IDs to detect common cyberattacks, visit Red Team Recipe.
Brute force attacks Identified by multiple EventID 4625 entries followed by EventID 4624 if the attack succeeds.
Time Change System time changes logged by EventID 4616 can complicate forensic analysis.
Tracking USB Devices Useful system event IDs for tracking USB devices include 20001/20003/10000 for initial use, 10100 for driver updates, and EventID 112 from DeviceSetupManager for insertion timestamps.
System Power Events EventID 6005 indicates system startup, while EventID 6006 indicates shutdown.
Log deletion Security event 1102 signals the deletion of logs, a critical event for forensic analysis.