28.10.2024
18 min
1158

We reveal the methods of counting the number of people at protests and mass gatherings, in particular, using the MapChecking tool. Using photos from different angles and determining the crowd density, you can roughly estimate the number of attendees. The article includes three main steps: choosing a location, delineating the counting zone, and determining the crowd density for an accurate estimate.

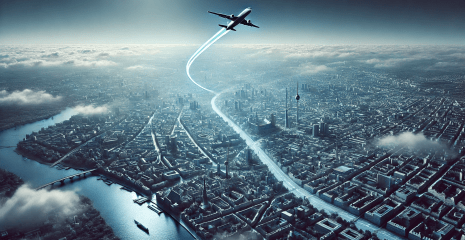
Large-scale protests in Israel have drawn huge crowds, raising questions about the number of participants. Crowd size is often an indicator of support for a cause, so determining the number of people attending demonstrations is an important skill for verification professionals. This allows for a more accurate assessment of social activity and public opinion regarding important events.
The developers of MapChecking have simplified crowd counting in public places, making it more convenient. This system, powered by Google Maps, allows researchers to define a geographic area and calculate how many people can fit in that space.
You need to perform three simple steps:
Find a location.
Determine the counting area.
Calculate the crowd density.
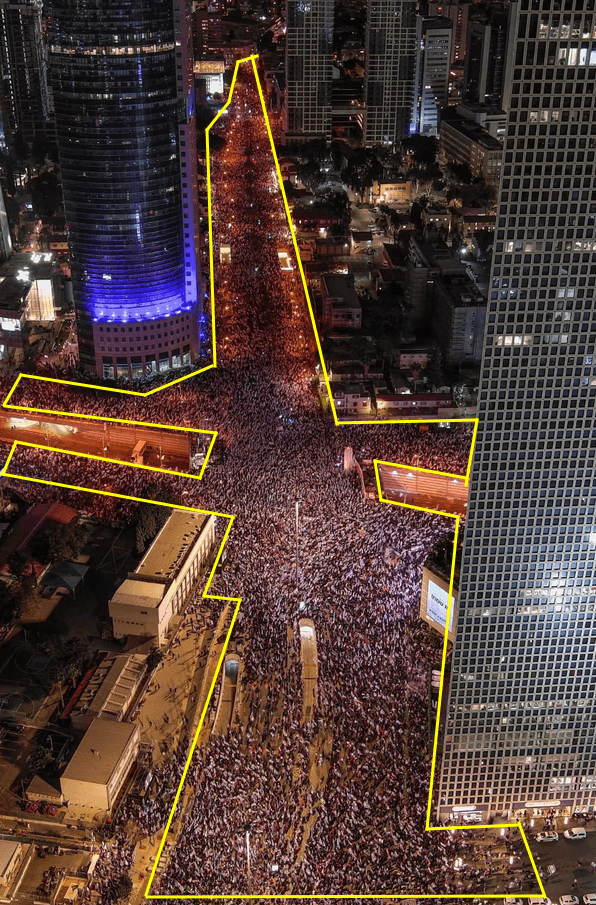
Let’s go through them to get a rough idea of how many people are in the image above.
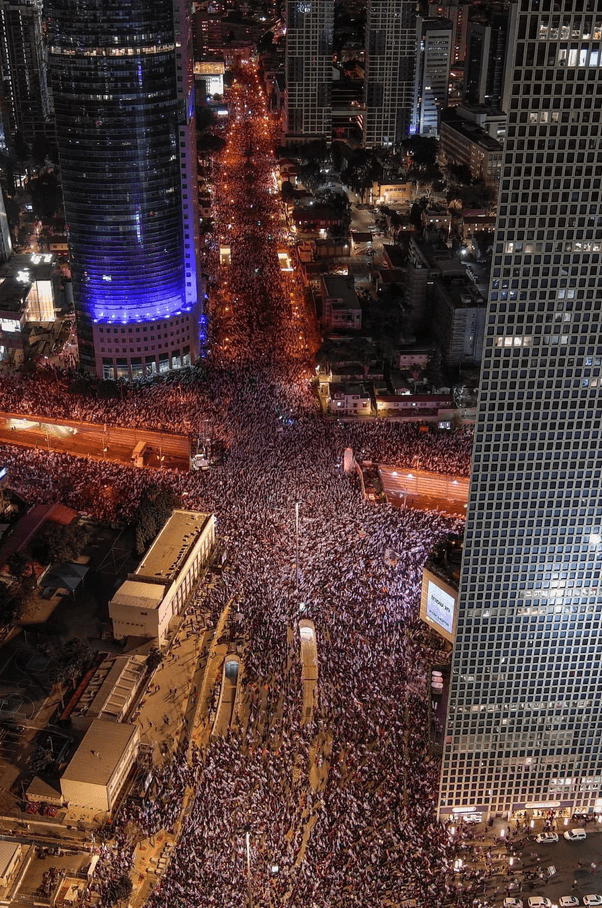
First, you need to determine the exact location. Fortunately, for public protests, this is usually not too difficult due to extensive media coverage and available documentation. The image above was taken in Tel Aviv on Givat HaTahmoshet Street.
The tall cylindrical building on the left is the government complex. Someone from the protest has already uploaded a panoramic photo from this place, which makes checking the correctness of the location quite easy.
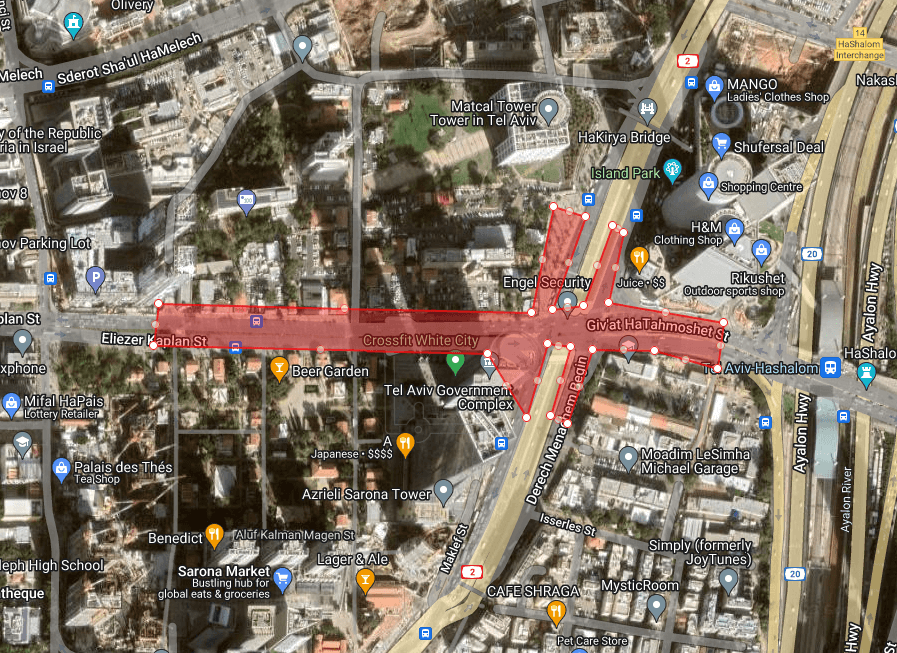
Now that the location is determined, the next step is to use MapChecking to plot the area where the crowd can be seen in the original photo. You should try to reproduce this area:
For the sake of accuracy, it is important to consider that there may be people in the crowd who are not visible on the map due to obstructions in the form of buildings. It would be better to combine several photos from different angles to achieve more accuracy, but for this tutorial the process will be simplified.
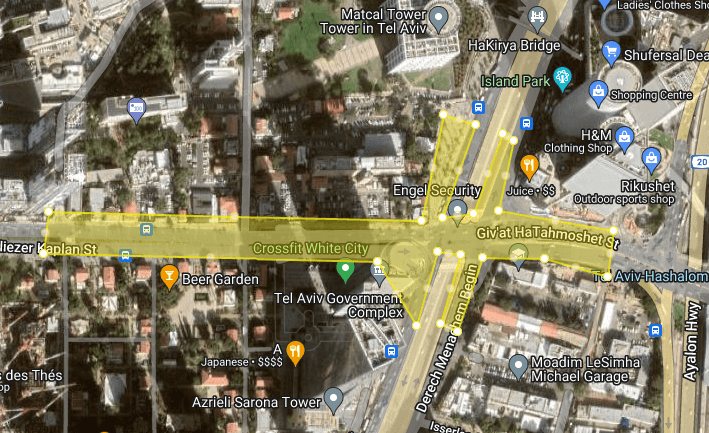
The location on the map is already defined, so the next step is to render it in MapChecking. It’s as simple as going to the desired location in the map interface and using the mouse to draw the area where the crowd is visible in the photo.
The final form looks something like this:
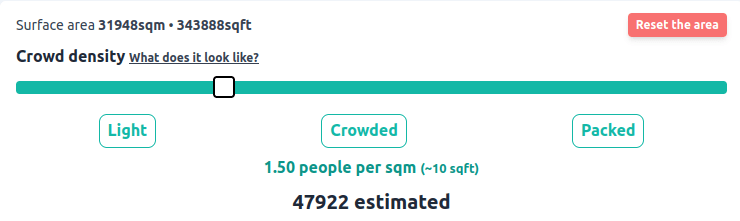
There is one last step before we can estimate how many people are in the image. It is necessary to know the density of people per square meter in order to understand how many there are in a certain area. MapChecking provides the ability to adjust the density using a slider:
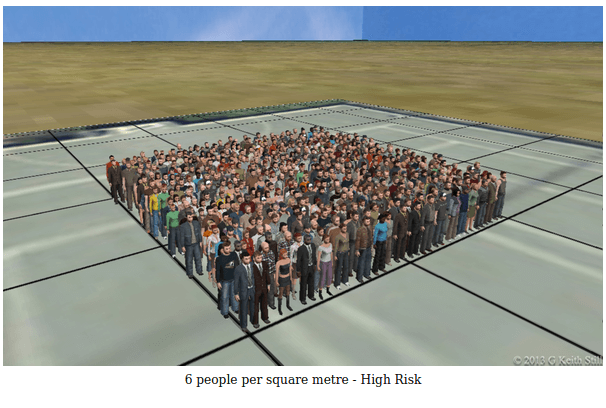
The biggest challenge is how to accurately determine density. The crowd is unevenly distributed, so it’s worth acknowledging that the resulting value won’t be super accurate to one digit, but an approximate value is usually enough. To make this process easier, below are some example images that show different crowd densities.
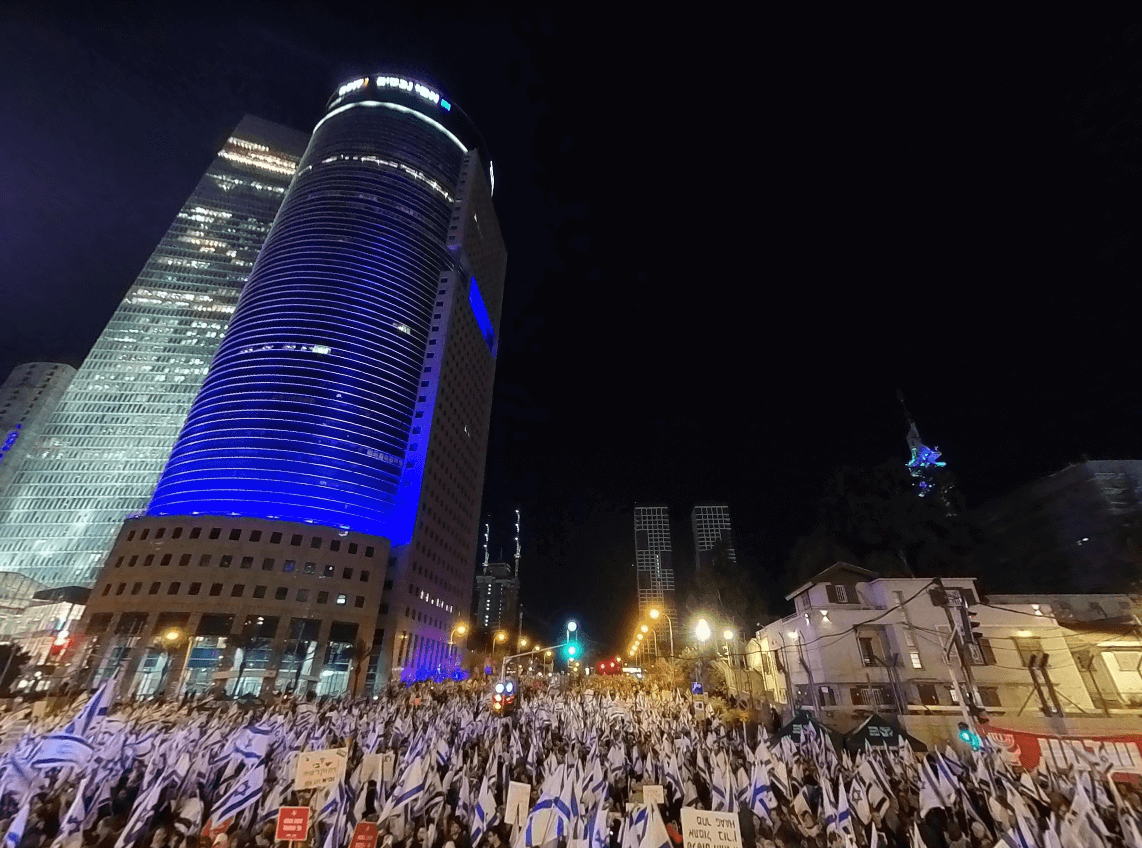
With additional close-up shots of the crowd thanks to Google Photo spheres, they can be compared to the base images from Keith Still’s study to get a rough idea of the density. Here is the density of the crowd observed during the protest:
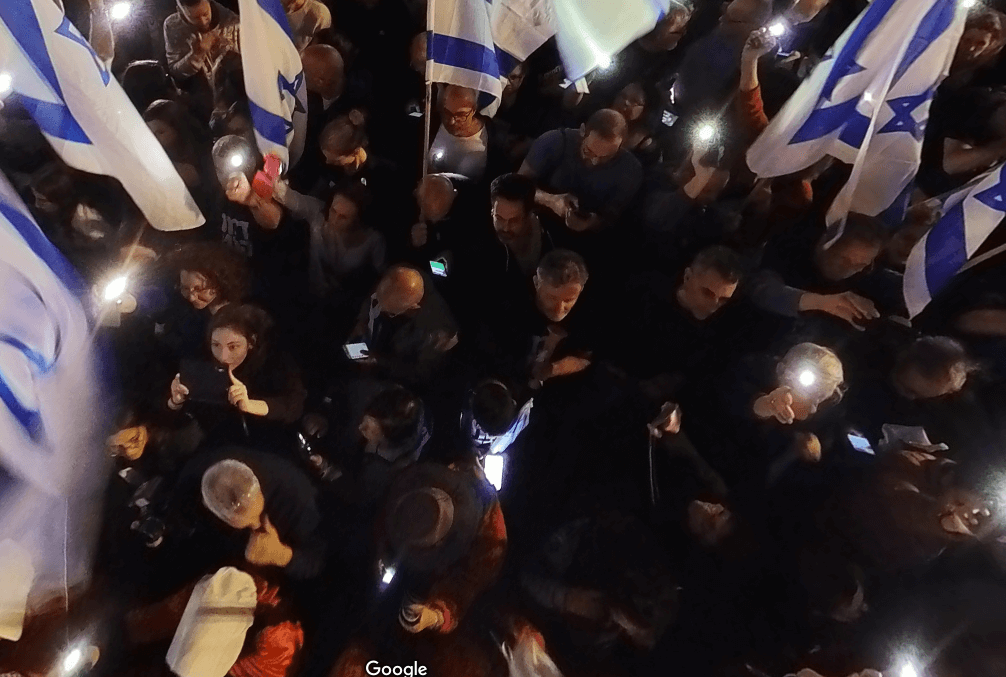
Let’s compare them to the base images. The crowd looks pretty tight, but people can still hold their phones and flags in front of them, indicating that they’re not so packed that they can’t move. So this density is probably not enough for 6 people per square meter.
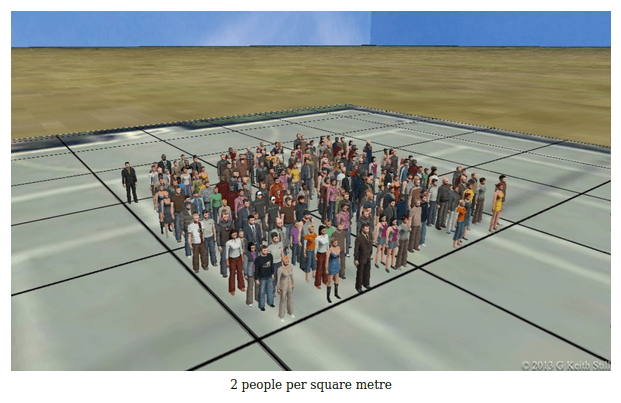
About 3-4 people per square meter looks like a better approximation:
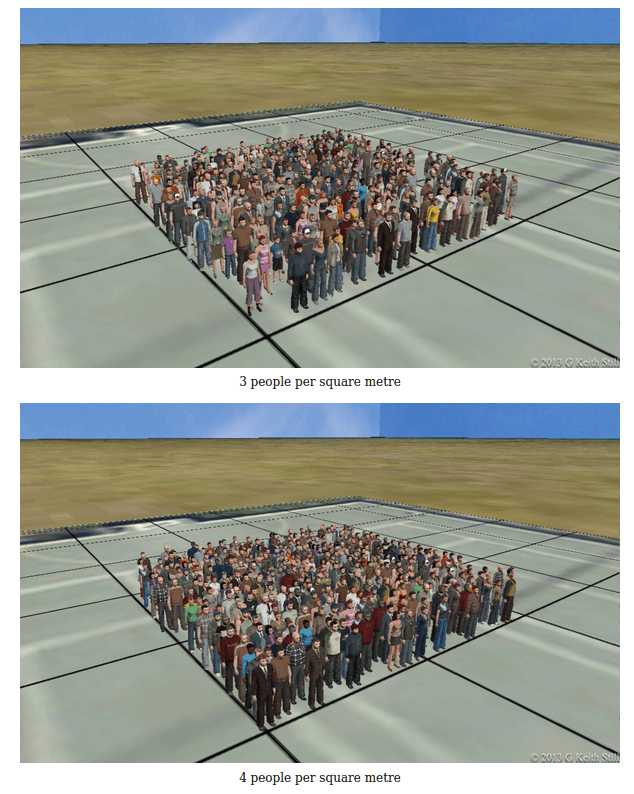
To calculate the final number, a value of 3.5 people per square meter will be used. The crowd is indeed denser in the center, but more dispersed at the edges. Using the slider to enter a density value allows us to determine how many people are in the area we’ve drawn according to the photo:
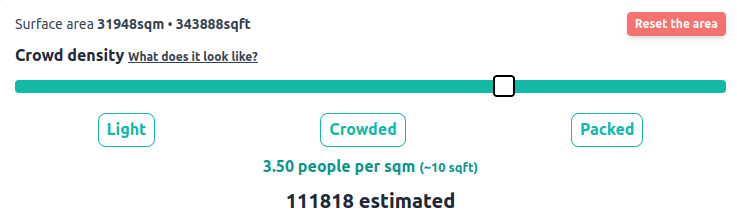
To account for the uncertainty associated with varying crowd densities, it’s useful to be able to adjust a slider that allows you to define upper and lower bounds for the possible crowd size. At a density of 2.5 people per square meter, the number of people in the crowd decreases to just under 80,000, while at a density of 4.5 people per square meter, it increases to 140,000. The optimal value will be somewhere between these two figures.