
18.03.2024
7 min
1929

Various aspects of analyzing, debugging, and phasing macOS applications are covered. It covers static and dynamic analysis techniques, as well as various tools and techniques that can be used to investigate applications on macOS.

otool -L /bin/ls #List dynamically linked libraries
otool -tv /bin/ps #Decompile application
objdump -m --dylibs-used /bin/ls #List dynamically linked libraries
objdump -m -h /bin/ls # Get headers information
objdump -m --syms /bin/ls # Check if the symbol table exists to get function names
objdump -m --full-contents /bin/ls # Dump every section
objdump -d /bin/ls # Dissasemble the binary
objdump --disassemble-symbols=_hello --x86-asm-syntax=intel toolsdemo #Disassemble a function using intel flavour
The tool can be used as a replacement for codesign , otool and objdump and provides several additional features. Download it here or install it with brew.
# Install
brew install --cask jtool2

jtool2 -l /bin/ls # Get commands (headers)
jtool2 -L /bin/ls # Get libraries
jtool2 -S /bin/ls # Get symbol info
jtool2 -d /bin/ls # Dump binary
jtool2 -D /bin/ls # Decompile binary

# Get signature information
ARCH=x86_64 jtool2 --sig /System/Applications/Automator.app/Contents/MacOS/Automator

# Get MIG information
jtool2 -d __DATA.__const myipc_server | grep MIG
Codesign can be found on macOS and ldid on iOS
# Get signer
codesign -vv -d /bin/ls 2>&1 | grep -E "Authority|TeamIdentifier"

# Check if the app’s contents have been modified
codesign --verify --verbose /Applications/Safari.app

# Get entitlements from the binary
codesign -d --entitlements :- /System/Applications/Automator.app # Check the TCC perms

# Check if the signature is valid
spctl --assess --verbose /Applications/Safari.app

# Sign a binary
codesign -s <cert-name-keychain> toolsdemo

# Get signature info
ldid -h <binary>

# Get entitlements
ldid -e <binary>

# Change entilements
## /tmp/entl.xml is a XML file with the new entitlements to add
ldid -S/tmp/entl.xml <binary>
SuspiciousPackage is a useful tool for checking .pkg files (installers) and seeing what’s inside before installing. These installers have preinstall and postinstallbash scripts, which are commonly abused by malware authors to preserve their malware.
This tool allows you to mount Apple disk image ( .dmg ) files to test them before running:
hdiutil attach ~/Downloads/Firefox\ 58.0.2.dmg
It will be installed in /Volumes/Volumes
Note that programs written in Objective-C preserve their class declarations when compiled into Mach-O binaries. Such class declarations include name and type:
Class
Class methods
Class instance variables
You can get this information using class-dump :
class-dump Kindle.app
Note that these names can be obfuscated to make reversing the binary difficult.
Function call
When a function is called in a binary that uses object-C, the compiled code will call objc_msgSend instead of calling that function. Which will call the last function:
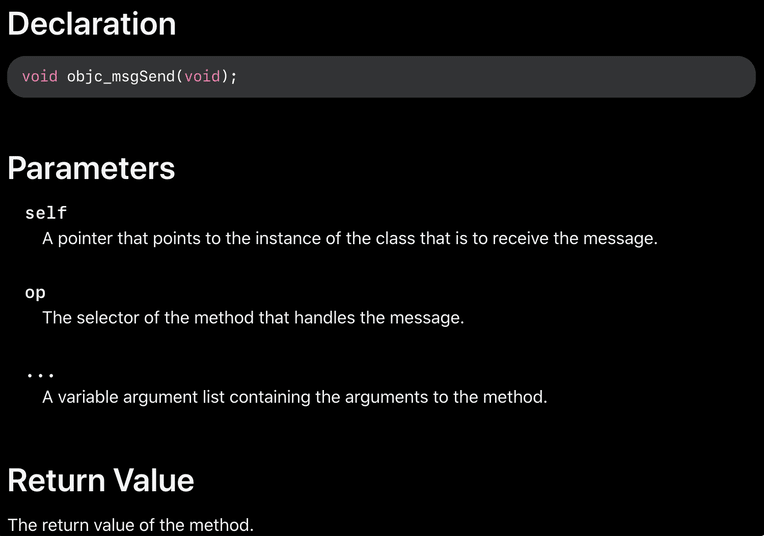
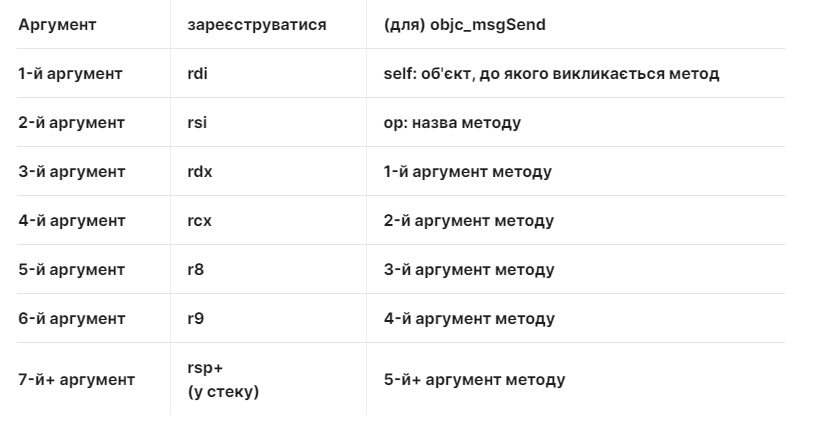
Parameters expected by this function:
The first parameter ( self ) is “a pointer to an instance of the class that should receive the message.” Or more simply, it is the object on which the method is called. If the method is a class method, it will be an instance of the class object (as a whole), while for an instance method, self will point to the created instance of the class as the object.
The second parameter ( op ) is the “selector of the method that handles the message”. Again, simply put, this is just a method name.
The rest of the parameters are any values required by the (op) method.
With Swift binaries, because there is compatibility with Objective-C, you can sometimes extract declarations using the dump class, but not always.
Using the jtool -la or otool -l command line, you can find several sections that start with the __swift5 prefix:
jtool2 -l /Applications/Stocks.app/Contents/MacOS/Stocks
LC 00: LC_SEGMENT_64              Mem: 0x000000000-0x100000000    __PAGEZERO
LC 01: LC_SEGMENT_64              Mem: 0x100000000-0x100028000    __TEXT
    [...]
    Mem: 0x100026630-0x100026d54        __TEXT.__swift5_typeref
    Mem: 0x100026d60-0x100027061        __TEXT.__swift5_reflstr
    Mem: 0x100027064-0x1000274cc        __TEXT.__swift5_fieldmd
    Mem: 0x1000274cc-0x100027608        __TEXT.__swift5_capture
    [...]
You can find more information about the information stored in these sections in this blog post.
Also, Swift binaries can have symbols (for example, libraries must store symbols so that their functions can be called). Symbols usually contain function name and attr information in a messy way, so they are very useful, and there are demanglers that can get the original name:
# Ghidra plugin
https://github.com/ghidraninja/ghidra_scripts/blob/master/swift_demangler.py

# Swift cli
swift demangle
Check for high entropy
Check the lines (almost no intelligible line, packed)
The UPX packager for MacOS creates a section called “__XHDR”
Note that debugging SIP binaries needs to be disabled ( csrutil disable or csrutil enable –without debug ) or copy the binaries to a temporary folder and remove the signature codesign –remove-signature <binary-path> or enable debugging of the binary (you can use this script)
Note that in order to instrument system binaries (such as cloudconfigurationd) on macOS, SIP must be disabled (simply removing the signature will not work).
MacOS creates a lot of logs, which can be very useful when running a program trying to figure out what it’s doing.
Additionally, some logs include a <private> tag to hide some user or computer identifying information. However, a certificate can be installed to reveal this information. Follow the explanation here.
Left panel
On the left panel of the hopper you can see the symbols ( Labels ) of the binary file, the list of procedures and functions ( Proc ) and strings ( Str ). These are not all strings, but those defined in several parts of the Mac-O file (such as cstring or objc_methname ).
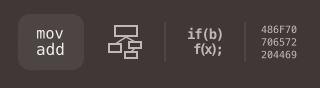
Middle panel
In the middle panel you can see the disassembled code. And you can see it in raw form, in graph form, in decompilation form and in binary form by clicking on the corresponding icon:
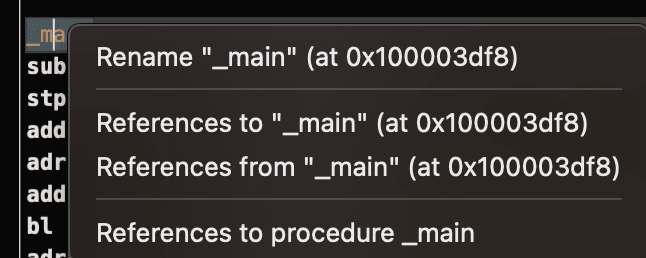
By right-clicking in a code object, you can see references to/from that object, or even change its name (this doesn’t work in decompiled pseudocode):
In addition, you can write python commands in the middle at the bottom.
Right panel
In the right panel, you can see interesting information such as the navigation history (so you know how you got to the current situation), the h call graph, where you can see all the functions that call this function , and all the functions that this function calls and information about local variables.
It allows users to access applications at an extremely low level and gives users the ability to monitor applications and even modify their execution flow. Dtrace uses probes that are placed throughout the kernel at places such as the start and end of system calls.
DTrace uses the dtrace_probe_create function to create a probe for each system call. These probes can be run at the entry and exit point of each system call. Interaction with DTrace is through /dev/dtrace, which is accessible only to the root user.
To enable Dtrace without completely disabling SIP security, you can execute in recovery mode:csrutil enable –without dtrace
You can also dtrace or dtruss the binaries you have compiled.
Available dtrace probes can be obtained using:
dtrace -l | head
   ID   PROVIDER            MODULE                          FUNCTION NAME
    1     dtrace                                                     BEGIN
    2     dtrace                                                     END
    3     dtrace                                                     ERROR
   43    profile                                                     profile-97
   44    profile                                                     profile-199
The probe name consists of four parts: provider, module, function, and name ( fbt:mach_kernel:ptrace:entry ). If you do not specify part of the name, Dtrace will use that part as a wildcard.
To configure DTrace to trigger probes and specify what actions to perform when they are triggered, we will need to use the D language.
A more detailed explanation and more examples can be found at https://illumos.org/books/dtrace/chp-intro.html
Run man -k dtrace to get a list of available DTrace scripts. example: sudo dtruss -n binary
In line
#Count the number of syscalls of each running process
sudo dtrace -n 'syscall:::entry {@[execname] = count()}'
syscall:::entry
/pid == $1/
{
}

#Log every syscall of a PID
sudo dtrace -s script.d 1234
syscall::open:entry
{
    printf("%s(%s)", probefunc, copyinstr(arg0));
}
syscall::close:entry
{
        printf("%s(%d)\n", probefunc, arg0);
}

#Log files opened and closed by a process
sudo dtrace -s b.d -c "cat /etc/hosts"
syscall:::entry
{
        ;
}
syscall:::return
{
        printf("=%d\n", arg1);
}

#Log sys calls with values
sudo dtrace -s syscalls_info.d -c "cat /etc/hosts"
dtruss -c ls #Get syscalls of ls
dtruss -c -p 1000 #get syscalls of PID 1000
You can use it even if SIP is activated
ktrace trace -s -S -t c -c ls | grep "ls("