Introduction to forensic memory
Memory forensics is a branch of digital forensics that examines random access memory (RAM) to uncover traces of system activity, running programs, network connections, and other important data that disappear after a device is powered off. Unlike traditional storage analysis methods that focus on static data stored on hard drives, memory forensics allows you to examine dynamic information that exists only while the system is running.
Memory Structure
Process Structures
EPROCESS – Process Environment Block:
-
Location: Kernel Space
-
Forensic Value: Process Details, Threads, Descriptors
-
Analysis Command: sh vol.py -f mem.raw windows.pslist
PEB – Process Environment Block:
-
Location: Userspace
-
Forensic value: DLL, environment variables, command line
-
Analysis command: sh vol.py -f mem.raw windows.dlllist
VAD – Virtual Address Descriptor:
-
Location: Process Space
-
Forensic Value: Memory Mapping, Injected Code
-
Analysis Command: sh vol.py -f mem.raw windows.vadinfo
Core structures

SSDT – System Service Descriptor Table:
-
Location: Kernel Space
-
Forensic Value: Hooks, Rootkit Detection
-
Analysis Command: sh vol.py -f mem.raw windows.ssdt
IDT – Interrupt Descriptor Table:
-
Location: Kernel Space
-
Forensic Value: Interrupt Handlers, Hooks
-
Analysis Command: sh vol.py -f mem.raw windows.idt
KPCR – Processor Control Region:
-
Location: On each processor
-
Forensic value: Processor state, thread information
-
Analysis command: sh vol.py -f mem.raw windows.kpcr
Memory regions

Memory Pool – Kernel Pool Allocation:
-
Location: System Space
-
Forensic Value: Drivers, Objects
-
Analysis Command: sh vol.py -f mem.raw windows.poolscanner
Heap – Heap distribution process:
-
Location: Userspace
-
Forensic Value: Execution Data, Strings
-
Analysis Command: sh vol.py -f mem.raw windows.heaps
Stack – Stacks of threads:
-
Location: Thread Space
-
Forensic Value: Call Traces, Local Variables
-
Analysis Command: sh vol.py -f mem.raw windows.threads
File structures

FILE_OBJECT – File descriptor information:
-
Location: Kernel Space
-
Forensic Value: Open Files, Handles
-
Analysis Command: sh vol.py -f mem.raw windows.handles
VACB – Cache Management:
-
Location: System Space
-
Forensic Value: Cached File Data
-
Analysis Command: sh vol.py -f mem.raw windows.cachedump
MFT – Master File Table:
-
Location: File System
-
Forensic Value: File Metadata
-
Analysis Command: sh vol.py -f mem.raw windows.mftparser
Network structures

TCPT_OBJECT – TCP connection
-
Location: Kernel Space
-
Forensic Value: Network Connections
-
Analysis Command: sh vol.py -f mem.raw windows.netscan
UDP ENDPOINT – UDP Endpoints
-
Location: Kernel Space
-
Forensic Value: Listens to networks
-
Analysis Command: sh vol.py -f mem.raw windows.netscan
ETHREAD – Network Streams
-
Location: Process Space
-
Forensic Value: Connection Handlers
-
Analysis Command: sh vol.py -f mem.raw windows.handles
Registry structures

CM_KEY_BODY – Registry keys
-
Location: Registry Space
-
Forensic Value: System Configuration, Autostart
-
Analysis Command: sh vol.py -f mem.raw windows.registry.printkey
CM_KEY_VALUE – Registry value
-
Location: Registry Space
-
Forensic Value: Settings, Data
-
Analysis Command: sh vol.py -f mem.raw windows.registry.dumpkey
Hive – Registry Hive
-
Location: File System
-
Forensic Value: Full Registry
-
Analysis Command: shvol.py -f mem.raw windows.hivelist
Common memory ranges
-
User space: 0x00000000 – 0x7FFFFFFFF
-
Kernel space: 0x80000000 – 0xFFFFFFFF
-
System space: 0xC0000000 – 0xFFFFFFFF
Definition and importance of forensic memory
Memory forensics refers to the process of capturing and analyzing the contents of a system’s non-volatile memory (RAM) to uncover evidence of cybercrime, attacks, and other system activity. This allows investigators to view processes, network connections, encryption keys, login credentials, malware, and other hidden evidence that may not be stored on the hard drive.
Importance
-
Persistent Data Retrieval: RAM stores temporary information such as active processes, credentials, and data in use that is lost when a machine is powered down. Memory forensics allows investigators to retrieve this data before it is lost, which is critical for incident response and forensics.
-
Malware and Rootkit Detection: Memory forensics is particularly useful for detecting sophisticated malware and rootkits that may be hiding in memory to evade traditional disk-based detection methods.
-
Network Traffic Analysis: It can help detect network connections, open ports, and even malicious network communication in real time.
-
Encryption Key Recovery: Sometimes critical encryption keys or passwords are stored in memory, and memory forensics can help recover them.
-
Living Evidence: Memory forensics often allows investigators to obtain evidence while the system is still operating, preventing the loss of important information that could be overwritten during normal system operation.
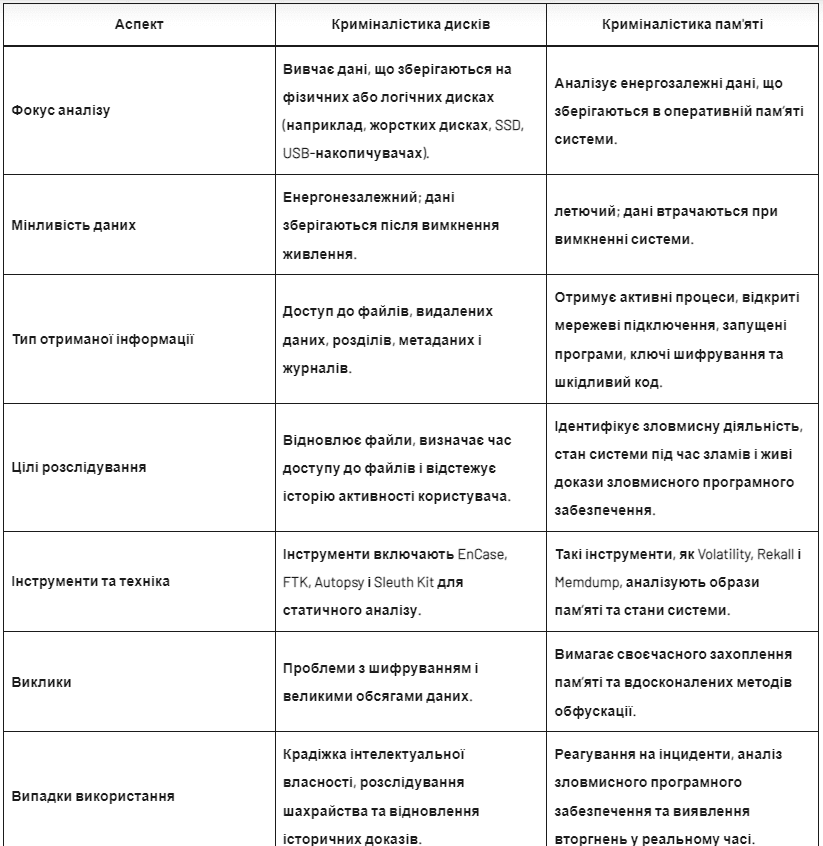
Key Differences Between Disk Forensics and Memory Forensics
Volatility Basics
-
Framework Architecture. The Volatility Framework is a powerful memory analysis tool designed for analyzing memory dumps. Its modular design allows it to be extended with plugins, allowing users to explore a wide range of memory artifacts.
-
Installation and Configuration. Volatility can be installed on Windows, Linux, and macOS. Dependencies such as Python and memory profiles are required for effective analysis.
-
Cross-platform support. The framework supports memory dumps from various operating systems, including Windows, Linux, and macOS, offering versatility in cross-platform research.
-
Plugin Ecosystem. Volatility’s functionality is greatly expanded by an ecosystem of plugins that specialize in tasks such as process enumeration, registry analysis, and malware detection.
-
Memory Profile Selection. Accurate memory profile selection ensures that the framework can correctly interpret the memory dump by mapping it to the kernel and configurations of the target system.
vol.exe -f cridex.vmem imageinfo

Basic research plugins
Plugins such as pslist, psscan, and dlllist form the basis of forensic investigations. These tools provide detailed information about:
-
Active and hidden processes.
-
Loaded libraries.
-
Critical system components.
Key benefits:
-
Application Execution Tracing: Allows analysts to visualize the lifecycle of processes and identify anomalies.
-
Suspicious Activity Detection: Helps identify hidden or malicious processes.
-
Operational State Mapping: Provides a snapshot of the active state of the system for comprehensive forensic analysis.
Example command:
vol.exe -f cridex.vmem --profile=WinXPSP3x86 pslist
This command uses Volatility to analyze a memory dump (cridex.vmem) for a system with the specified profile (WinXPSP3x86) and lists active processes using the pslist plugin.

Advanced memory analysis workflows
Advanced memory analysis workflows use specialized techniques to detect hidden anomalies and hidden threats. These workflows are designed to:
-
Suspicious Process Injection Detection: Detect malicious code injected into legitimate processes.
-
Trace Memory-Resident Malware: Find malware that resides only in memory, avoiding disk-based detection methods.
-
Abnormally Mapped Memory Partition Detection: Detect misaligned or unusual memory mappings that may indicate malicious activity.
By systematically analyzing memory structure and behavior, investigators can reconstruct malicious actions and improve their threat detection capabilities.
Custom plugin development
Volatility’s open and flexible architecture allows investigators to develop custom plugins to address specific forensic needs, such as:
-
Targeting specialized memory structures.
-
Analyzing the behavior of proprietary malware.
-
Exploring unconventional data artifacts.
Advantages of custom plugin development:
-
Extend Volatility’s core functionality.
-
Adapt to new investigative challenges.
-
Focus on unique and specialized forensic requirements.
Resource for plugin development:
Refer to the official documentation for instructions on creating custom plugins.: Volatility Plugin Development
Practical memory analysis workflows
Detecting malicious processes
Using tools like pslist and pstree, investigators can:
-
List and analyze processes running in memory.
-
Examine process hierarchies to identify anomalies.
-
Identify discrepancies such as:
-
- Unusual relationships between parents and children.
- Processes hiding under legitimate names.
- Unknown or suspicious processes that exhibit abnormal behavior.
Example workflow:
1. runpslist:
vol.exe -f memory_dump.vmem --profile=Win7SP1x64 pslist
List of active processes for analysis.
2. runpstree:
vol.exe -f memory_dump.vmem --profile=Win7SP1x64 pstree
Displays hierarchical relationships between processes, helping to detect malicious activity.

Researching running processes
Examining running processes is an important step in memory forensics, especially when analyzing potential malware such as Cridex. This section describes an approach to identifying suspicious processes using Volatility.
Steps to investigate running processes
-
Check for suspicious process names. Malware often masquerades as legitimate process names. A detailed inspection of the process list can help identify anomalies.
-
Check for processes with different parent process identifiers (PPIDs). Processes with unexpected or unusual parent process identifiers may indicate tampering or introduction by attackers. Analyzing PPID relationships provides important clues.
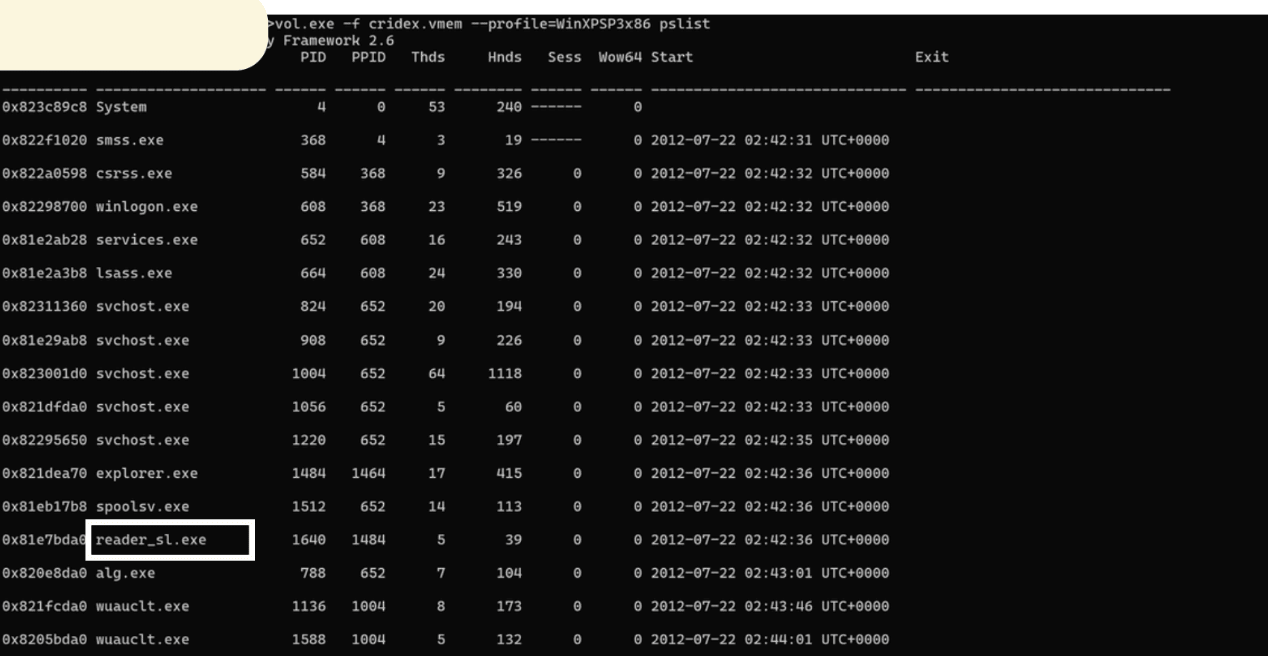
Case Study: Identification of reader_sl.exe
In this investigation, the malware is disguised as the process name reader_sl.exe.
Analysis Command
To inspect running processes and identify suspicious entries such as reader_sl.exe, use the following Volatility command:
vol.exe -f cridex.vmem --profile=WinXPSP3x86 pslist
-
-f cridex.vmem: specifies a memory dump file to analyze.
-
–profile=WinXPSP3x86: Specifies a memory profile that matches the target system (Windows XP SP3 x86).
-
pslist: lists all running processes and their parent-child relationships.
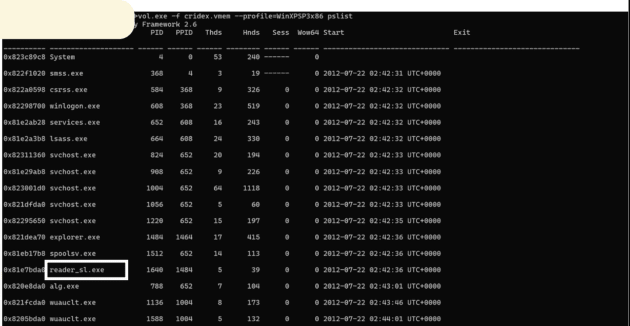
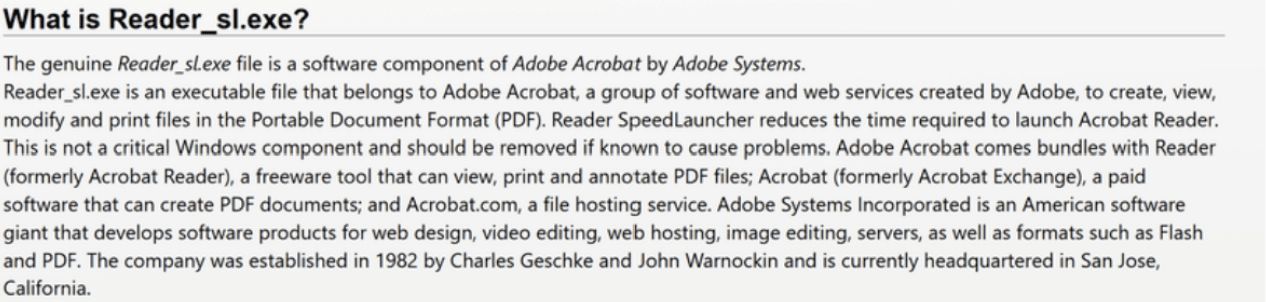
When choosing a name for a suspicious process, we will need to know what the function of the process is, as well as what the purpose of this suspicious process is.
Based on the search results, it is suspected that the infected host machine may have been compromised by malicious documents such as .pdf or .docx.
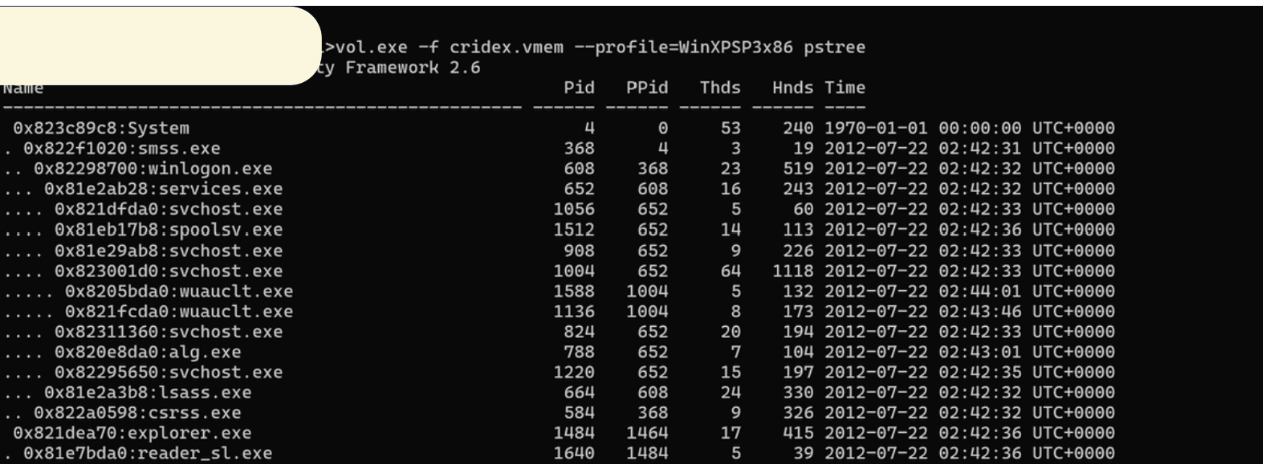
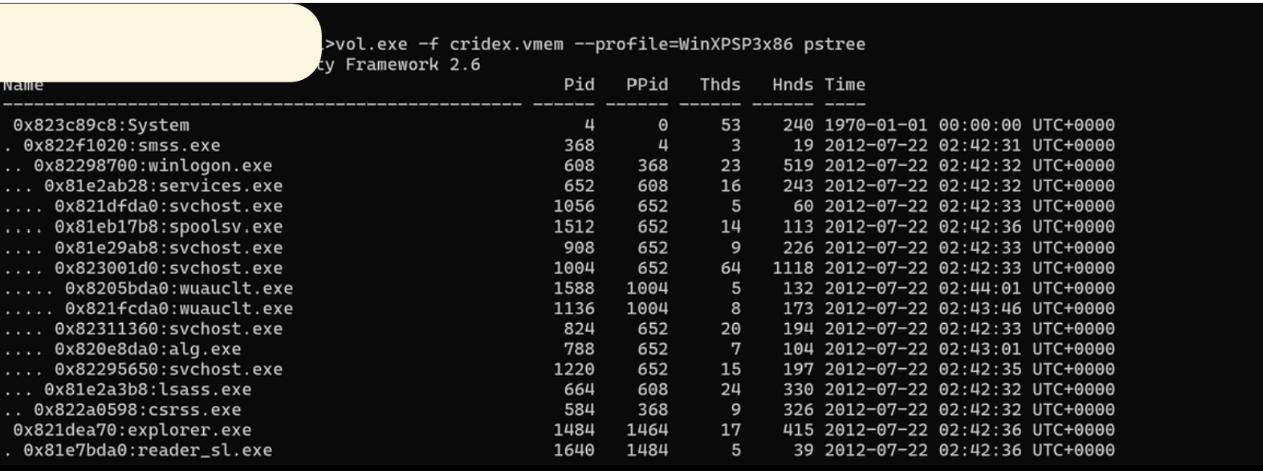
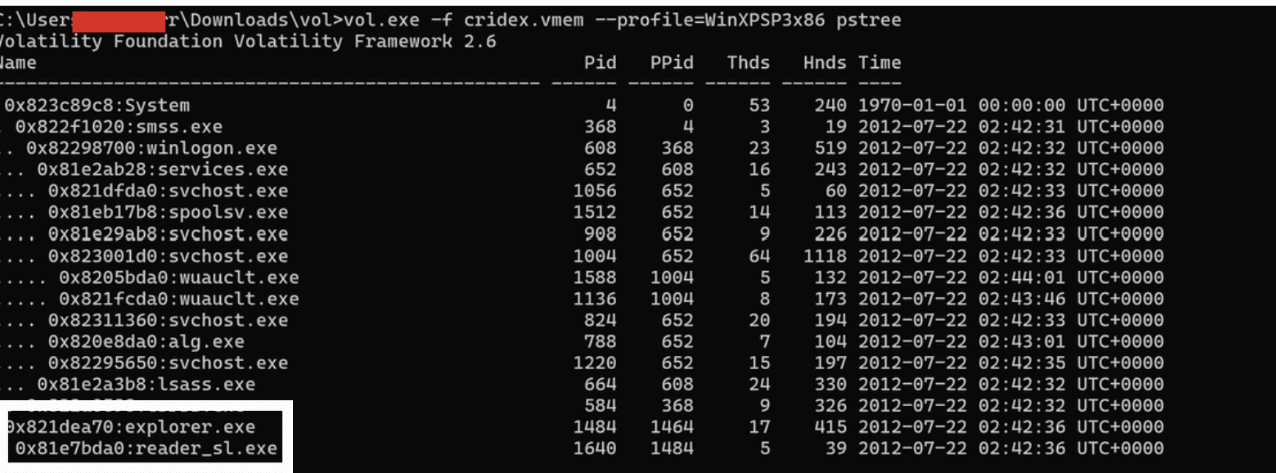
Tracing the Creator of reader_sl.exe
Another plugin from Volatility, pstree, can be used to determine which process or program created reader_sl.exe. This analysis can provide additional clues for investigation.
vol.exe -f cridex.vmem --profile=WinXPSP3x86 pstree
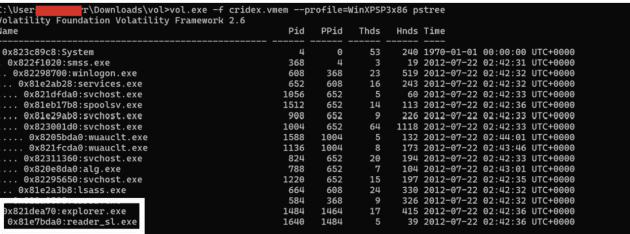
Analysis using the pstree plugin
Based on the details provided by the pstree plugin, we have a clue that explorer.exe creates reader_sl.exe. This potentially indicates that the infected host machine has opened malicious documents, such as those received from an attacker.
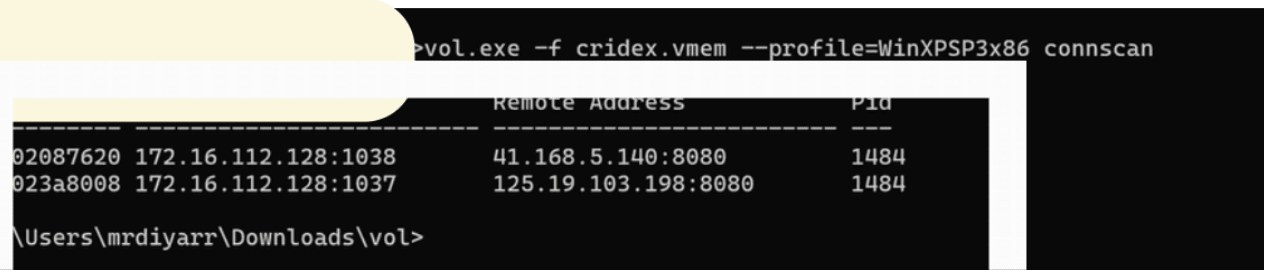
Examining a process’s Internet connection
Examining a process’s Internet connection in memory forensics is crucial for detecting potential malicious activity, such as communication with command and control (C&C) servers.

Processes with remote connections
During the analysis, two processes were detected that connected to remote addresses:
-
explorer.exe
-
Suspicious process: reader_sl.exe
Logical analysis
A logical question arises: why does reader_sl.exe establish an internet connection?
For further investigation, it is important to check the remote IP address associated with this connection on VirusTotal or similar threat analysis platforms for possible malicious activity.
-
Parent Process ID (PPID): 1484 (this is the PPID for reader_sl.exe.)

Conclusion
Memory forensics is an important area of digital forensics, providing critical evidence that may be lost after a system is powered down. Unlike traditional disk analysis, memory forensics focuses on dynamic data such as running processes, network connections, encryption keys, and other transient artifacts.
Continue reading in Part 2, which will cover advanced memory analysis techniques, forensics automation, advanced threat detection, the use of AI in digital forensics, and advanced mobile device memory analysis.