
05.03.2025
9 min
1019

In the second part of the article, we will take a closer look at deep memory analysis techniques used to examine the RAM of computers and mobile devices in forensic investigations. You will learn how to detect hidden threats such as rootkits, injection processes, and malware that may not leave traces on the hard drive.

Process Tree Reconstruction
This technique involves mapping the parent-child relationships between processes in memory to detect anomalies in the process hierarchy.
By reconstructing the complete process tree, researchers can uncover abnormal or unexpected relationships, such as hidden processes masquerading as legitimate ones, which may indicate the presence of malware.
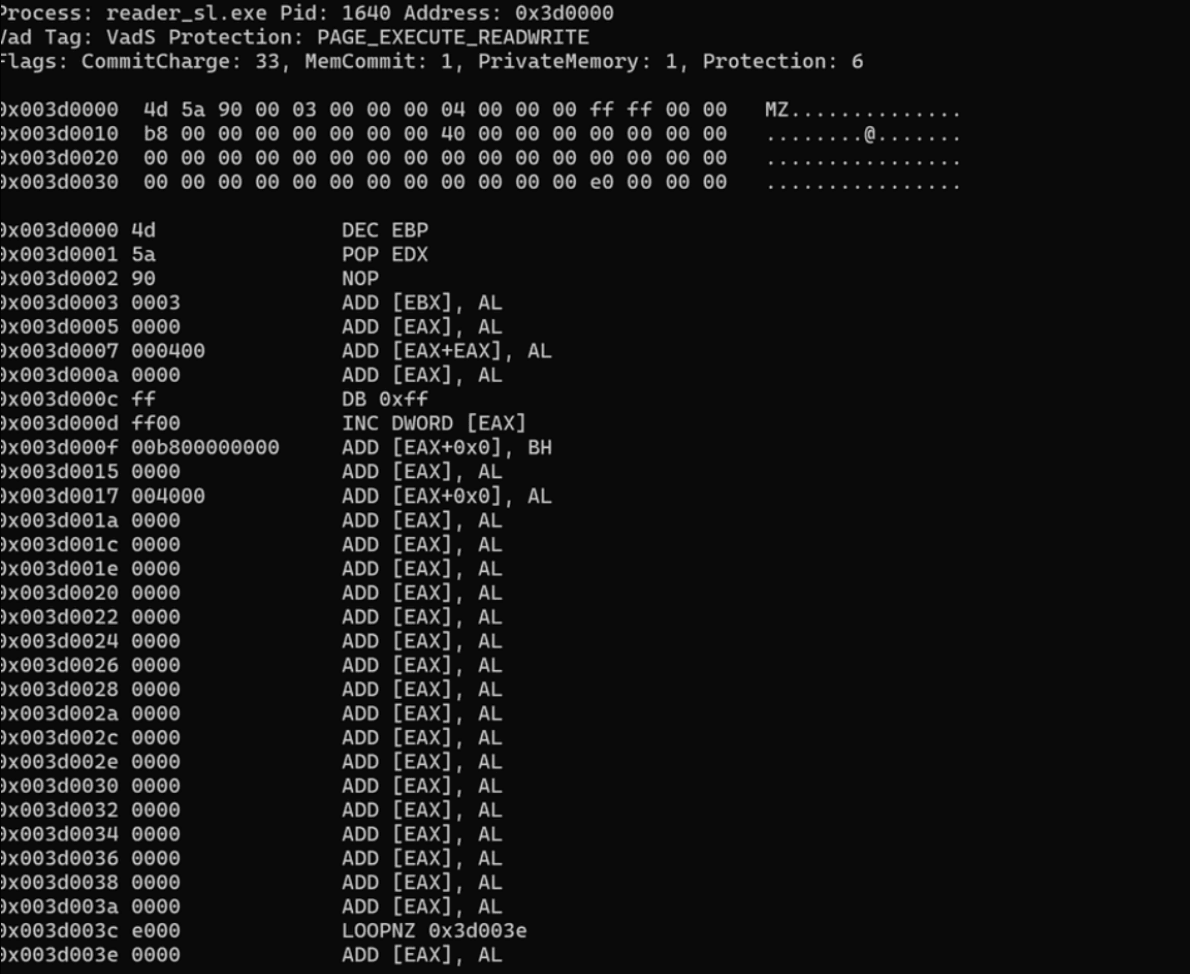
Detecting Hidden and Injected Processes
Tools such as psscan and malfind are important for detecting hidden processes or those that are injected into legitimate ones. These processes may not show up in standard process enumeration tools, but they can be detected by scanning memory for:
Modified process structures
Injected payloads
Such findings often indicate malicious activity.
Examining kernel-mode threads is crucial as they can signal the presence of rootkits or OS-level compromise.
Operate at the kernel level to hide activity.
Detect suspicious characteristics, such as hiding from user-mode monitoring tools.
Interact directly with the OS kernel to avoid detection.
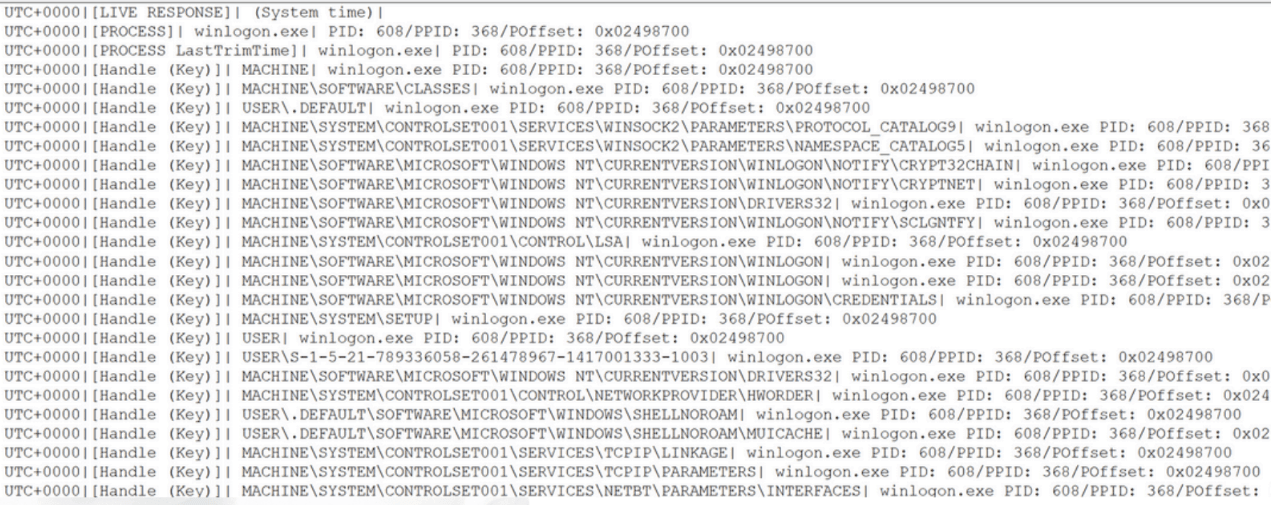
The Volatility timeline plugin is used to create a timeline of events based on timestamps derived from various artifacts in the memory image.
This timeline is invaluable for understanding the sequence of actions in a system, particularly during incident response or forensic investigations.
1. Normal use:
vol.exe -f cridex.vmem --profile=WinXPSP3x86 timeliner
2. Pipeline output to a text file:
vol.exe -f cridex.vmem --profile=WinXPSP3x86 timeliner > timeline.txt
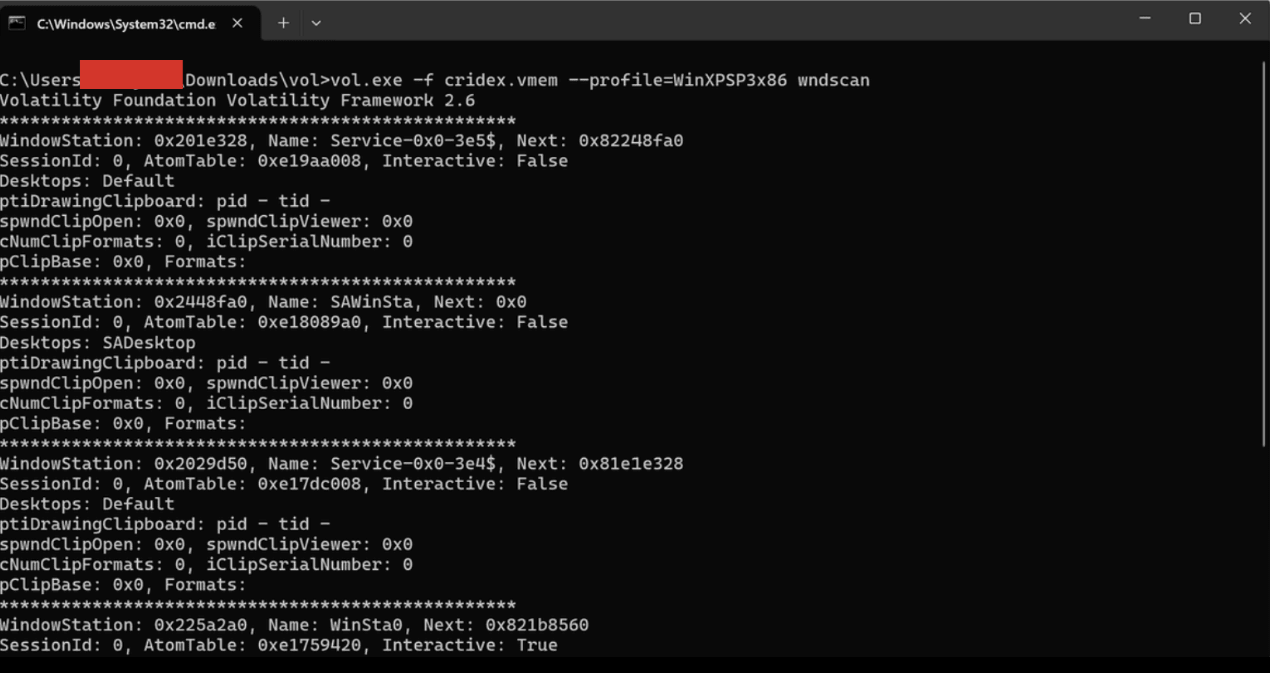
The Volatility wndscan plugin is used to search for window objects in memory.
This feature is particularly useful for identifying both visible and hidden windows created by processes that may include malware-related activity and suspicious behavior.
1. Normal use
vol.exe -f cridex.vmem --profile=WinXPSP3x86 wndscan
2. Pipeline output to a text file:
vol.exe -f cridex.vmem --profile=WinXPSP3x86 wndscan > wnd.txt
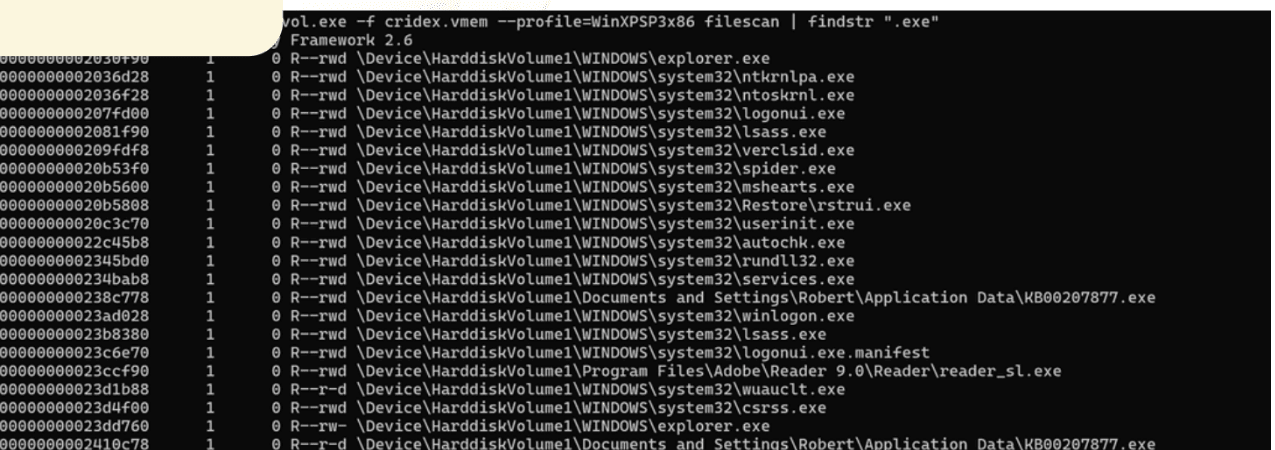
The Volatility filescan plugin is used to identify file objects in memory that may not have been mapped to disk.
This is particularly useful for detecting hidden or injected files that can be used by malware.
vol.exe -f cridex.vmem --profile=WinXPSP3x86 filescan
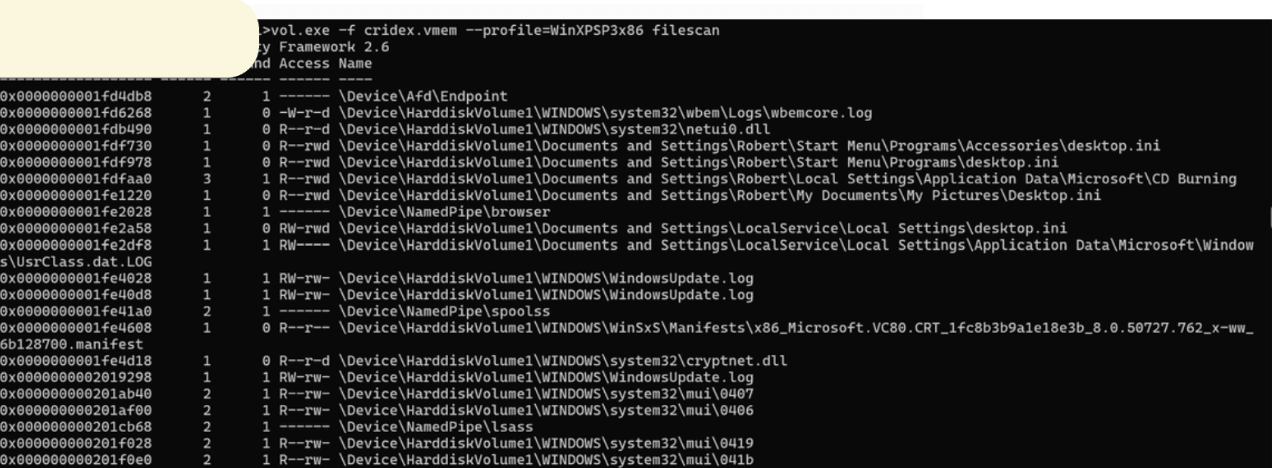
Note: Regarding your time. we can use | findstr in windows or | grep in Linux to search for a specific file.
The malfindVolatility plugin is a powerful tool for detecting potential malware in memory dumps.
It scans for injected code or anomalous memory sections that are commonly associated with malware.
vol.exe -f cridex.vmem --profile=WinXPSP3x86 malfind
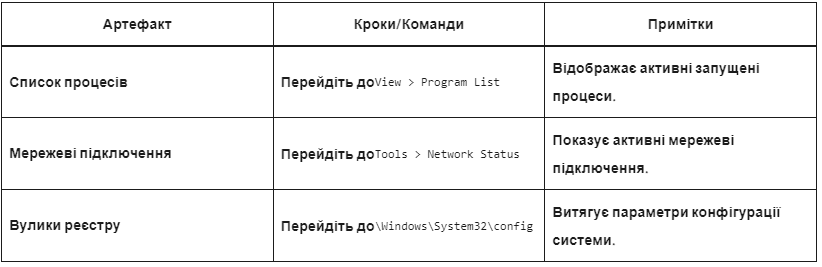
Registry Hive Recovery: Extracting and analyzing registry hives from memory to detect configuration changes or malware persistence mechanisms.
Network Connection Tracing: Identifying live or historical network connections to analyze possible data theft or communication with command and control (C2) servers.
Authentication Session Forensics: Examining authentication tokens, session IDs, and the use of user credentials stored in memory.
Cached Credential Inspection: Analyzing cached credentials to detect possible credential harvesting or misuse.

Kernel-Mode Rootkit Identification: Detects rootkits that operate at the kernel level by analyzing kernel memory and system structures.
Trap Mechanism Detection: Detects modifications to system call tables, built-in traps, or API hijacking techniques used by malware.
Memory-Based Rootkit Analysis: Analyzes memory structures to identify hidden drivers, kernel modules, or other malicious artifacts.
Anti-Forensic Identification: Detects malware attempts to evade detection, such as memory wiping or data encryption.
A. Additional Memory Forensics Tools
Rekall Framework: A similar-featured alternative to Volatility, focused on live memory analysis and performance optimization.
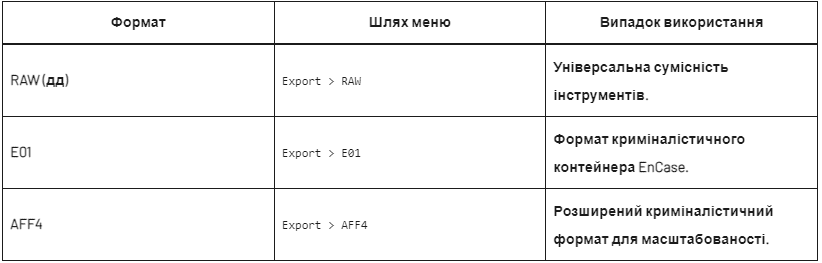
FTK Imager: A tool for creating and analyzing forensic images, including memory dumps.
WindowsSCOPE: A commercial solution that offers visualization and detailed memory analysis capabilities.
Memory Analysis Script Collections: Scripts designed to automate repetitive tasks during memory analysis, streamlining the forensics workflow.
Implement continuous memory capture techniques that enable real-time streaming of volatile memory
Develop mechanisms to detect and capture memory changes as they occur
Use memory discrepancies to identify significant changes between records
Use Intel Processor Trace (PT) for detailed execution tracing
Implement direct memory access (DMA) acquisition techniques.
Leverage modern processor features such as AMD Secure Memory Encryption (SME) for reliable data acquisition
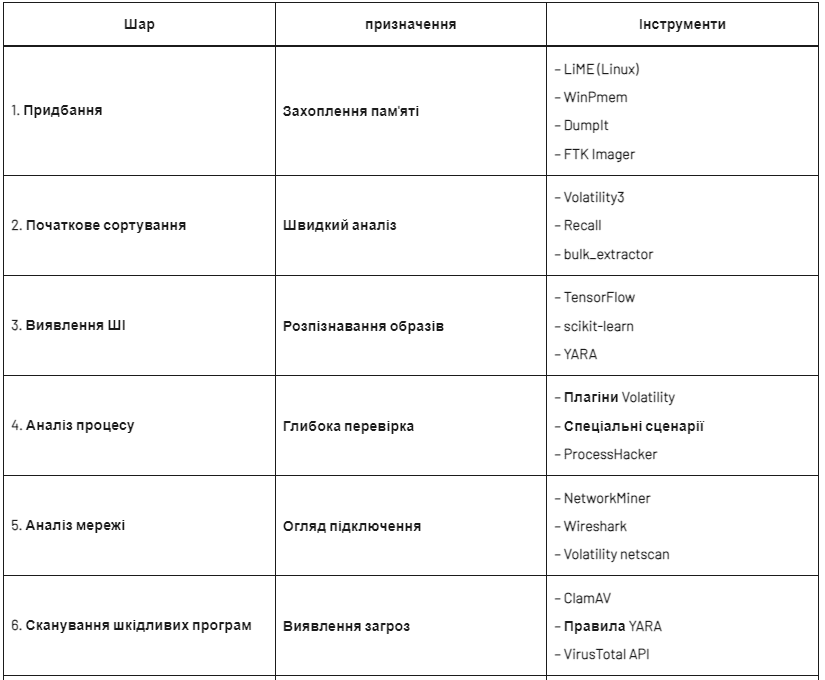
LiME (Linux Memory Extractor)
# Install LiME on Linux
git clone https://github.com/504ensicsLabs/LiME
cd LiME/src
make

# Capture memory
sudo insmod lime-<version>.ko "path=/tmp/memory.lime format=lime"
WinPMEM (Windows)
# Capture full memory dump
winpmem_mini_x64_rc2.exe memory.raw

# Capture with compression
winpmem_mini_x64_rc2.exe -c memory.raw
Deploy supervised learning models to detect anomalous process behavior
Implement clustering algorithms to identify groups of related malicious actions
Use deep learning to recognize patterns in memory structures
TensorFlow implementation:
import tensorflow as tf

class MemoryAnomalyDetector:
    def __init__(self):
        self.model = tf.keras.Sequential([
            tf.keras.layers.Dense(128, activation='relu'),
            tf.keras.layers.Dropout(0.2),
            tf.keras.layers.Dense(64, activation='relu'),
            tf.keras.layers.Dense(1, activation='sigmoid')
        ])

    def train(self, memory_features, labels):
        self.model.compile(optimizer='adam',
                          loss='binary_crossentropy',
                          metrics=['accuracy'])

        return self.model.fit(memory_features, labels,
                            epochs=10,
                            validation_split=0.2)
Develop specialized tools for analyzing container RAM
Implement methods for correlating container memory with host system memory
Create methods for analyzing container exit attempts
Docker Memory Analysis:
# Capture Docker container memory
docker-forensics -c container_id -o output_dir

# Analysis script
python3 analyze_container_memory.py output_dir/container_memory.raw
# Container memory analysis implementation
class DockerMemoryAnalyzer:
    def __init__(self, memory_dump):
        self.memory_dump = memory_dump

    def analyze_container_escape(self):
        # Check for privileged operations
        privileged_ops = self._scan_privileged_operations()

        # Check for mounted sensitive paths
        mount_violations = self._check_mount_violations()

        # Check for capability abuse
        capability_abuse = self._detect_capability_abuse()

        return {
            'privileged_ops': privileged_ops,
            'mount_violations': mount_violations,
            'capability_abuse': capability_abuse
        }
Implement memory analysis methods in distributed systems
Develop tools for serverless functional memory health analysis
Create methods for correlating memory artifacts across cloud services
Implement Behavior-Based Detection Methods
Develop Methods to Identify Code Mutation Patterns in Memory
Create Methods to Track Malware Evolution in Memory Snapshots
Implement Kernel Integrity Verification Mechanisms
Develop Methods to Detect Advanced Connection Methods
Create Tools to Detect Complex Privilege Escalation Attempts
Volatility 3 with Custom Plugins
# Custom plugin for encrypted process detection
import yara
from volatility3.framework import interfaces

class EncryptedProcessDetector(interfaces.plugins.PluginInterface):
    _required_framework_version = (2, 0, 0)

    def run(self):
        # Load YARA rules for encryption detection
        rules = yara.compile(source='''
            rule EncryptionIndicators {
                strings:
                    $aes = {67 74 71 6E 28 73 76 71}
                    $rsa = {82 65 78 61 2D 70 75 62}
                condition:
                    any of them
            }
        ''')

        # Scan process memory
        for proc in self.context.processes:
            matches = rules.match(data=proc.get_process_memory())
            if matches:
                yield (0, (proc.UniqueProcessId,
                          proc.ImageFileName.cast("string"),
                          "Encryption Detected"))
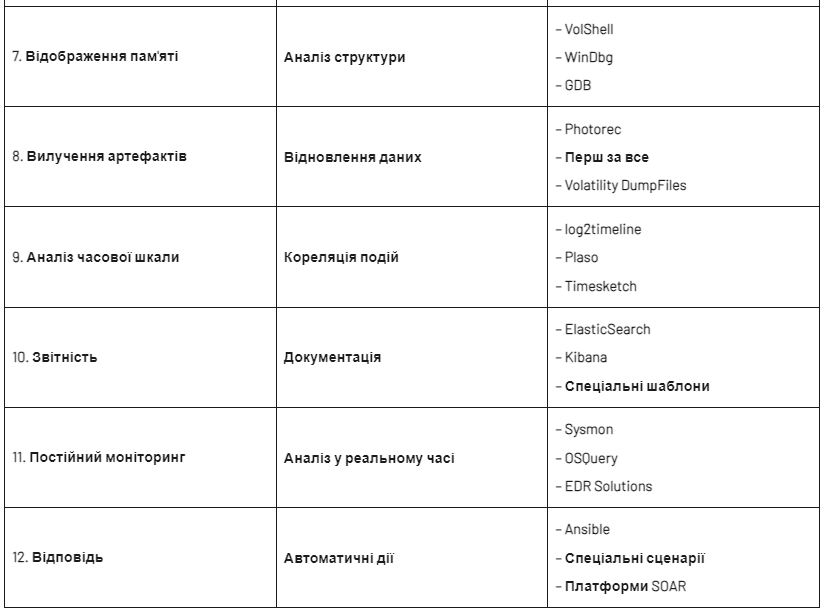
Implement automated sorting systems for memory dumps
Develop intelligent mechanisms for filtering relevant artifacts
Create automated reporting systems
Implement real-time memory monitoring systems
Develop automatic mechanisms for notification of suspicious memory activity
Create systems for continuous baseline comparison
class MemoryForensicsPipeline:
    def __init__(self):
        self.volatility = VolatilityInterface()
        self.yara_scanner = YaraScanner()
        self.ml_detector = MemoryAnomalyDetector()

    def analyze_memory_dump(self, dump_path):
        # Stage 1: Initial triage
        profile = self.volatility.identify_profile(dump_path)
        processes = self.volatility.get_processes(dump_path, profile)

        # Stage 2: Deep analysis
        suspicious_processes = []
        for process in processes:
            score = self._analyze_process(process)
            if score > THRESHOLD:
                suspicious_processes.append(process)

        # Stage 3: Advanced detection
        malware_detection = self.yara_scanner.scan(dump_path)
        anomaly_detection = self.ml_detector.analyze(dump_path)

        # Stage 4: Report generation
        return self._generate_report(
            suspicious_processes,
            malware_detection,
            anomaly_detection
        )

    def _analyze_process(self, process):
        return {
            'pid': process.pid,
            'name': process.name,
            'memory_regions': self._analyze_memory_regions(process),
            'network_connections': self._analyze_network(process),
            'handles': self._analyze_handles(process),
            'threads': self._analyze_threads(process)
        }
Memory forensics is a powerful digital forensics tool that allows you to retrieve and analyze critical data from the RAM of computers and mobile devices. Unlike traditional disk forensics, which focuses on static data, memory forensics provides access to dynamic artifacts that may be lost after a system is powered down.