15.04.2024
3 min
2001

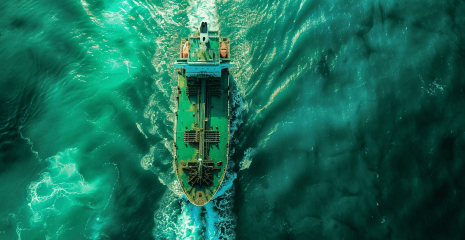
Explore advanced online environmental monitoring tools that use the latest technology to track the state of the atmosphere, energy production, forest and vegetation conditions, and wildlife migration. The article will be devoted to various environmental monitoring tools and platforms that allow you to visualize and analyze data on air quality, energy production and consumption, the state of forests and vegetation, and also allow you to track the migration of wild animals.
Monitoring the level of air quality in real time. It will be useful if you want to know the AQI index, the content of particles in the atmosphere of different calibers.

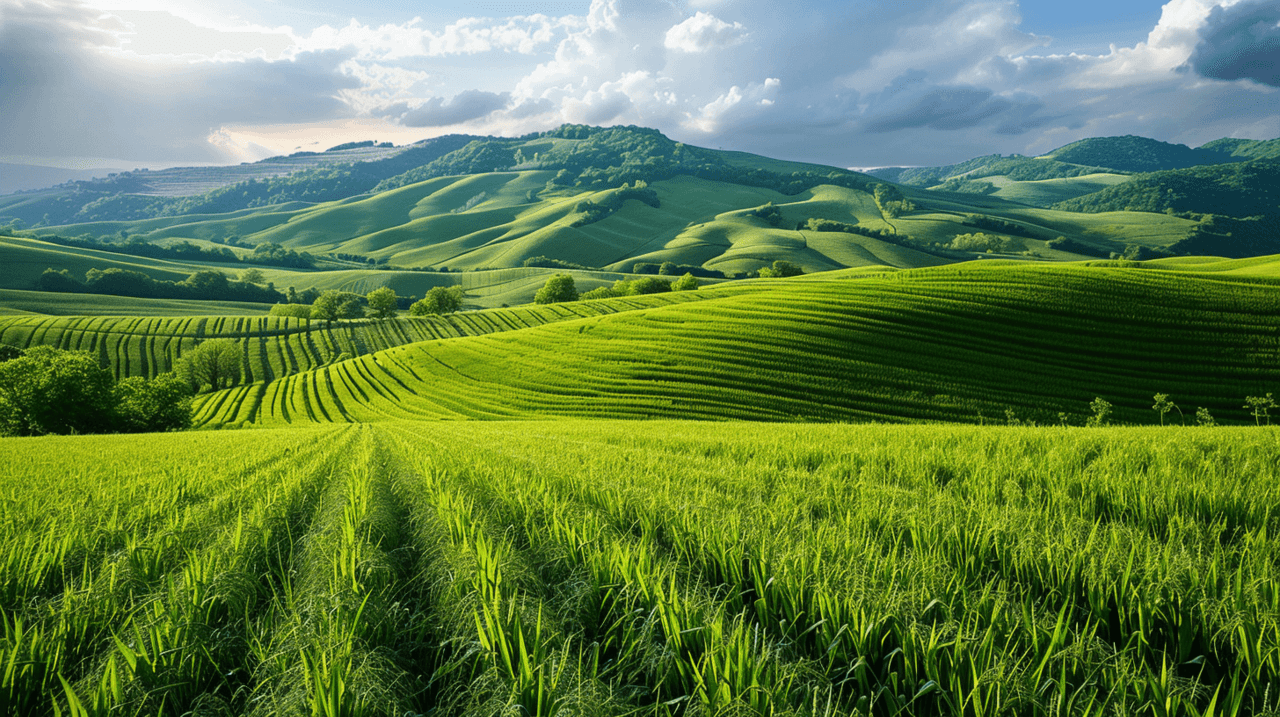
Interactive map with AI-detected fields and crops. Provides insight into local and global trends in crop production and examines crop distribution and acreage.

Yes, this program allows you to track the geolocation of sharks (and other large sea creatures). Carefully watching them, you can easily feel like Doctor Evil.

Online platform for forest monitoring. It is used to detect and prevent illegal activities (for example, deforestation), fires, protection of land and resources, conducting nature conservation research.

US Energy Information Administration. It contains many interactive cards for tracking the state of energy infrastructure, floods and storms, as well as a large array of statistical data in the form of graphs and tables.
Dynamic World Dashboard with land use and vegetation data at 10m resolution, updated every 2-5 days. Powered by ML as a result of Google’s partnership with World Resources Institute .

An interactive dashboard from NASA that provides the ability to visualize various data about the Earth in real time. This platform shows important aspects of the state of the planet, including climate change, air temperature, carbon dioxide concentrations and other important environmental indicators.
This is an online tool for monitoring air quality, which provides detailed information about the state of the atmosphere in different regions of the world (updated every 3-5 minutes). It allows users to obtain data on the level of air pollution, the concentration of harmful particles and gases in the atmosphere.

Visualization of electricity sources and CO2 emissions. An open source project that allows you to study the impact of electricity production on the climate. For example, arrows between regions indicate the real movement (import and export) of electricity between zones: the faster they flash, the more intense the flow.