05.12.2025
50 min
643

The second part discusses practical tools for traffic analysis and network diagnostics. The material explains the principles of building an Ethernet bridge, using BPF filters, working with tcpdump and tshark, as well as the capabilities of the Snort attack detection system. The text helps to form a holistic understanding of how to use FreeBSD for deep network monitoring and security without going into the technical details that are already covered in the article itself.

In the FreeBSD OS, you can create a network bridge between any number of network interfaces, moreover, they do not necessarily have to be of the Ethernet type. But in this context, we are interested in a bridge of two built-in Etherent ports, which are issued under certain names. To find out what network interfaces are in the system, use the system utility ifconfig, enter the command:
sniffer@sniffer:~ % ifconfig -l
re0 re1 lo0 wlan0 ng0
The result is a simple list of interface names separated by spaces. In this case, the interfaces re0 and re1 are Ethernet ports. You can also get more detailed information about them using ifconfig:
sniffer@sniffer:~ % ifconfig re0
re0: flags=8902<BROADCAST,PROMISC,SIMPLEX,MULTICAST> metric 0 mtu 1500
        options=8209b<RXCSUM,TXCSUM,VLAN_MTU,VLAN_HWTAGGING,VLAN_HWCSUM,WOL_MAGIC,LINKSTATE>
        ether 68:1d:ef:47:de:0a
        media: Ethernet autoselect (none)
        status: no carrier
        nd6 options=29<PERFORMNUD,IFDISABLED,AUTO_LINKLOCAL>

sniffer@sniffer:~ % ifconfig re1
re1: flags=8902<BROADCAST,PROMISC,SIMPLEX,MULTICAST> metric 0 mtu 1500
        options=8209b<RXCSUM,TXCSUM,VLAN_MTU,VLAN_HWTAGGING,VLAN_HWCSUM,WOL_MAGIC,LINKSTATE>
        ether 68:1d:ef:47:de:0b
        media: Ethernet autoselect (none)
        status: no carrier
        nd6 options=29<PERFORMNUD,IFDISABLED,AUTO_LINKLOCAL>
The ifconfig utility displays a large amount of information about the network interface, among which we may be interested in the MAC address (ether 68:1d:ef:47:de:0 and ether 68:1d:ef:47:de:0b), as well as the presence of a connection to a switch or other device (status: no carrier frequency”).
Information on how to configure Brigding (network bridge) can be easily obtained from the built-in system manual. Let’s look into it by entering the following command:
sniffer@sniffer:~ % man bridge

IF_BRIDGE(4)           FreeBSD Kernel Interfaces Manual           IF_BRIDGE(4)

NAME
     if_bridge – network bridge device

SYNOPSIS
     To compile this driver into the kernel, place the following line in your
     kernel configuration file:

           device if_bridge

     Alternatively, to load the driver as a module at boot time, place the
     following lines in loader.conf(5):

           if_bridge_load="YES"
           bridgestp_load="YES"

DESCRIPTION
     The if_bridge driver creates a logical link between two or more IEEE 802
     networks that use the same (or “similar enough”) framing format.  For
     example, it is possible to bridge Ethernet and 802.11 networks together,
     but it is not possible to bridge Ethernet and Token Ring together.
On the first page of the manual, we are asked to add two system modules (drivers) to the bootloader configuration file /boot/loader.conf. This can be done using the sysrc utility, specifying the name of the configuration file after the -f switch:
sniffer@sniffer:~ % sudo sysrc -f /boot/loader.conf if_bridge_load="YES"
Password: reffins
if_bridge_load:  -> YES

sniffer@sniffer:~ % sudo sysrc -f /boot/loader.conf bridgestp_load="YES"
bridgestp_load:  -> YES
The first driver, if_bridge, provides the network bridge functionality we need. The second driver, bridgestp, implements the Rapid Spanning Tree Protocol (RSTP, 802.1w) for bridge connections, which helps avoid random “loops” in the Ethernet network structure.
The next step is to actually create the bridge. In the same system manual (man bridge) we read further and see that in order for a network bridge to appear in the system, the following lines must be added to /etc/rc.conf:
EXAMPLES
     The following when placed in the file /etc/rc.conf will cause a bridge
     called “bridge0” to be created, and will add the interfaces “wlan0” and
     “fxp0” to the bridge, and then enable packet forwarding.  Such a
     configuration could be used to implement a simple 802.11-to-Ethernet
     bridge (assuming the 802.11 interface is in ad-hoc mode).

           cloned_interfaces="bridge0"

    ...

     For the bridge to forward packets, all member interfaces and the bridge
     need to be up.  The above example would also require:

    ...

           ifconfig_bridge0="addm em0 addm em1 DHCP"
           ifconfig_em0="up"
           ifconfig_em1="up"
The above example creates a new interface bridge0 and adds interfaces wlan0, fxp0, em0 and em1 to it. In this case, these additional (incoming) interfaces should be replaced with re0 and re1. The DHCP parameter in the bridge0 configuration indicates that the bridge will work even as a regular network interface, the IP address for it will be requested from the DHCP server. This is a very useful property of the bridge, allowing us to use it as a target transport for the mpd5 utility to organize a reverse tunnel. Summarizing all of the above, we get the following list of commands for configuring a network bridge:
sniffer@sniffer:~ % sudo sysrc cloned_interfaces="bridge0"
cloned_interfaces:  -> bridge0

sniffer@sniffer:~ % sudo sysrc ifconfig_bridge0="addm re0 addm re1 SYNCDHCP"
ifconfig_bridge0:  -> addm re0 addm re1 SYNCDHCP

sniffer@sniffer:~ % sudo sysrc ifconfig_re0="up"
ifconfig_re0:  -> up

sniffer@sniffer:~ % sudo sysrc ifconfig_re1="up"
ifconfig_re1:  -> up
And that’s it. Now we need to reboot the operating system so that the two new drivers are loaded. We will do this with the reboot command:
sniffer@sniffer:~ % sudo reboot

Connection to 192.168.171.151 closed.
Immediately after entering this command, the SSH connection will be broken and the machine will reboot. In a minute, we will be able to connect to it again using the ssh command.
Let’s connect to the system and see what the network interface bridge0 we created looks like, using the ifconfig utility again:
sniffer@sniffer:~ % ifconfig bridge0
bridge0: flags=1008843<UP,BROADCAST,RUNNING,SIMPLEX,MULTICAST,LOWER_UP> metric 0 mtu 1500
        options=0
        ether 58:9c:fc:10:ff:d7
        id 00:00:00:00:00:00 priority 32768 hellotime 2 fwddelay 15
        maxage 20 holdcnt 6 proto rstp maxaddr 2000 timeout 1200
        root id 00:00:00:00:00:00 priority 32768 ifcost 0 port 0
        member: re1 flags=143<LEARNING,DISCOVER,AUTOEDGE,AUTOPTP>
                ifmaxaddr 0 port 2 priority 128 path cost 55
        member: re0 flags=143<LEARNING,DISCOVER,AUTOEDGE,AUTOPTP>
                ifmaxaddr 0 port 1 priority 128 path cost 55
        groups: bridge
        nd6 options=9<PERFORMNUD,IFDISABLED>
Here we see that bridge0 contains two other member interfaces: member: re0 and member: re1.
After creating a network bridge, it is necessary to check its operation. To do this, the sniffer should be connected between the host or network device under test and the main network. The device under test is hereinafter referred to as the DUT (Device Under Test).
The simplest example for testing can be an office network printer – for example, an HP LaserJet Pro 500. An additional UTP patch cord is used for connection: the DUT is connected to the first Ethernet port of the sniffer. The second patch cord, which previously connected the printer to the switch, now connects the second Ethernet port of the sniffer to the office switch.
After a few seconds, the indicators on the ports begin to blink actively, indicating that traffic is passing through the bridge. The ifconfig command then displays updated information about the state of the interfaces:
sniffer@sniffer:~ % ifconfig re0
re0: flags=1008943<UP,BROADCAST,RUNNING,PROMISC,SIMPLEX,MULTICAST,LOWER_UP> metric 0 mtu 1500
        options=8209b<RXCSUM,TXCSUM,VLAN_MTU,VLAN_HWTAGGING,VLAN_HWCSUM,WOL_MAGIC,LINKSTATE>
        ether 68:1d:ef:47:de:0a
        media: Ethernet autoselect (100baseTX <full-duplex>)
        status: active
        nd6 options=29<PERFORMNUD,IFDISABLED,AUTO_LINKLOCAL>

sniffer@sniffer:~ % ifconfig re1
re1: flags=1008943<UP,BROADCAST,RUNNING,PROMISC,SIMPLEX,MULTICAST,LOWER_UP> metric 0 mtu 1500
        options=8209b<RXCSUM,TXCSUM,VLAN_MTU,VLAN_HWTAGGING,VLAN_HWCSUM,WOL_MAGIC,LINKSTATE>
        ether 68:1d:ef:47:de:0b
        media: Ethernet autoselect (100baseTX <full-duplex>)
        status: active
        nd6 options=29<PERFORMNUD,IFDISABLED,AUTO_LINKLOCAL>
From the command output, we see that both interfaces re0 and re1 have entered the working state: both interfaces display status: active and the UP flag has been added to the list of flags.
Let’s try to listen to ICMP traffic on the bridge connection using the system utility tcpdump. By the way, it is included in the standard FreeBSD OS, so you don’t need to install anything.
Enter the command:
sniffer@sniffer:~ % sudo tcpdump -i bridge0 icmp
Password: reffins
tcpdump: verbose output suppressed, use -v[v]... for full protocol decode
listening on bridge0, link-type EN10MB (Ethernet), snapshot length 262144 bytes
The tcpdump utility is running and listening to network traffic on the bridged connection, selecting only ICMP packets from it, as indicated by the icmp line that specifies the filtering rule (we will talk about rules in more detail later).
Next, open a new terminal window on the working computer and enter the ping command:
rz@butterfly:~ % ping 192.168.169.14
PING 192.168.169.14 (192.168.169.14): 56 data bytes
64 bytes from 192.168.169.14: icmp_seq=0 ttl=254 time=4.501 ms
64 bytes from 192.168.169.14: icmp_seq=1 ttl=254 time=3.283 ms
64 bytes from 192.168.169.14: icmp_seq=2 ttl=254 time=5.427 ms
^C
--- 192.168.169.14 ping statistics ---
3 packets transmitted, 3 packets received, 0.0% packet loss
round-trip min/avg/max/stddev = 3.283/4.404/5.427/0.878 ms
The ping command sends ICMP requests to the host with the specified IP address. In this example, the address 192.168.169.14 corresponds to the office MFP. After sending several packets, ping can be interrupted by pressing Ctrl-C. In parallel, messages from the tcpdump utility immediately appear in the terminal connected via SSH to the sniffer, which record the passage of ICMP traffic through the bridge:
20:20:36.309894 IP 192.168.176.155 > 192.168.169.14: ICMP echo request, id 63017, seq 0, length 64
20:20:36.310397 IP 192.168.169.14 > 192.168.176.155: ICMP echo reply, id 63017, seq 0, length 64
20:20:37.373156 IP 192.168.176.155 > 192.168.169.14: ICMP echo request, id 63017, seq 1, length 64
20:20:37.373573 IP 192.168.169.14 > 192.168.176.155: ICMP echo reply, id 63017, seq 1, length 64
20:20:38.437588 IP 192.168.176.155 > 192.168.169.14: ICMP echo request, id 63017, seq 2, length 64
20:20:38.437957 IP 192.168.169.14 > 192.168.176.155: ICMP echo reply, id 63017, seq 2, length 64
To stop tcpdump, press Ctrl-C. After pressing it, you return to the tcsh shell, and before exiting, the utility displays brief statistics about the collected traffic and the parameters of the capture that occurred:
^C
6 packets captured
365 packets received by filter
0 packets dropped by kernel
sniffer@sniffer:~ %
From the tcpdump messages, we see that many packets passed through the interface during this time, but only 6 packets matched the filter rules. The tcpdump utility displayed information about these six packets earlier, these are three pairs of packets: of the type ICMP echo request from 92.168.176.155 > 192.168.169.14 (to the MFP from my work PC), and of the type ICMP ech6 rep1. 192.168.176.155 (response from the MFP). It is obvious that tcpdump can now spy on any traffic through the bridge, both towards the MFP and from it towards the network. Next, we will study in more detail the operation of tcpdump and some other traffic analysis utilities, as well as familiarize ourselves with the filtering rules provided by the built-in OS tool called Berkeley Packet Filter (BPF).
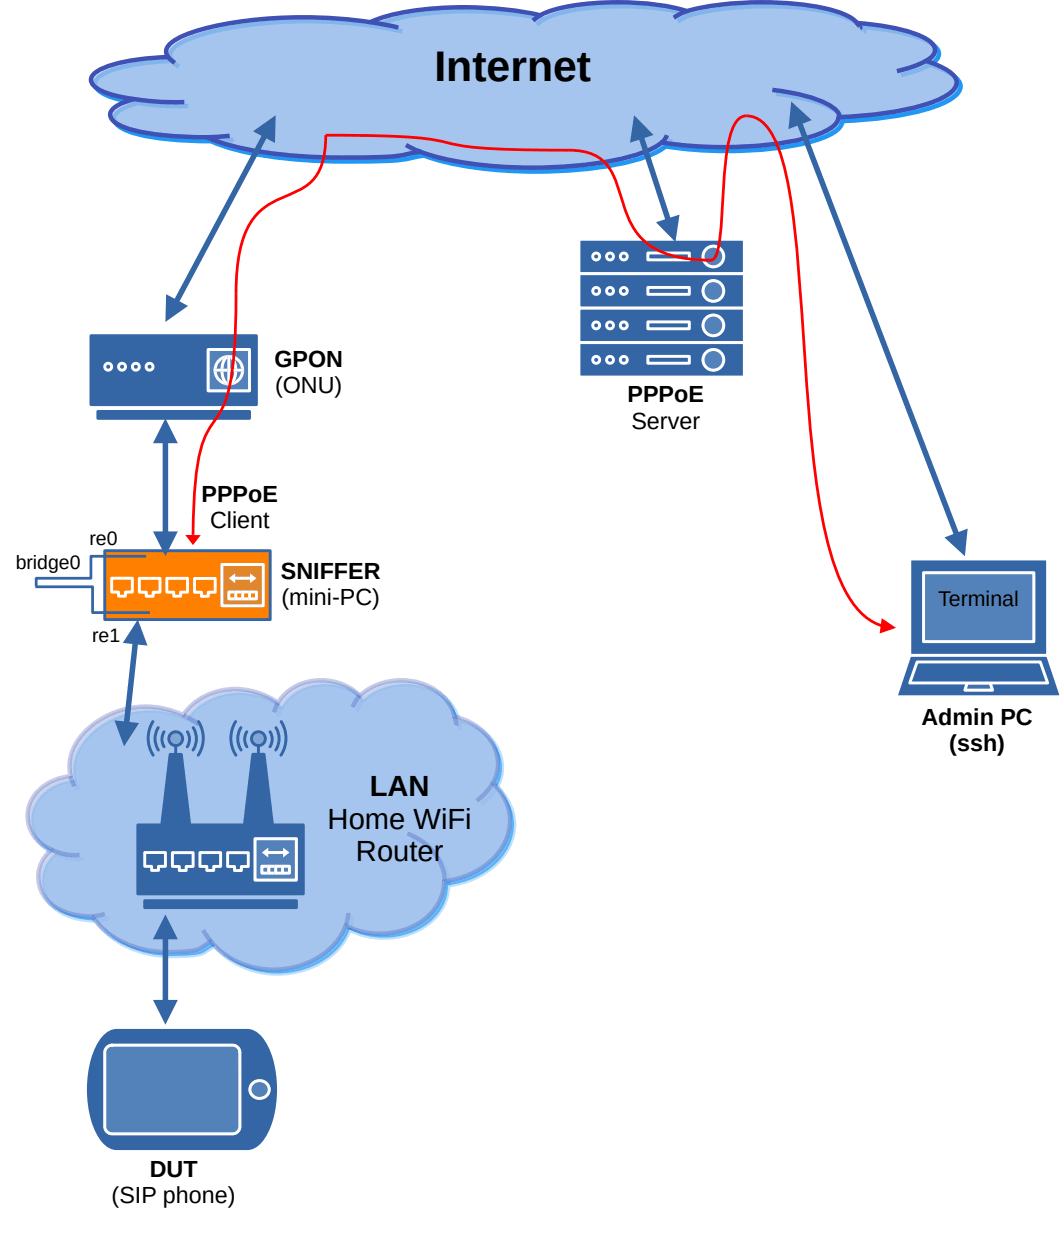
Before proceeding to the description of traffic analysis methods, let’s consider several options for activating a sniffer. In general, there can be many ways to activate a sniffer, they depend on the structure of the network being operated and on the method of organizing the control channel for accessing the sniffer. Below, in Fig. 8a, 8b, 8c and 8d, four methods for activating a sniffer in the network are shown, all of them are quite simple despite some clutter in the images. Let’s consider all four options.
The simplest scheme for activating a sniffer (Fig. 8a) is to connect it to the section between the device under test (DUT) and another network. This is the method that was described a little above the experiment with an MFP. The sniffer control channel in this case can be organized via a wireless local area network WiFi. The logical path of the control channel is indicated in the diagram by a red line.
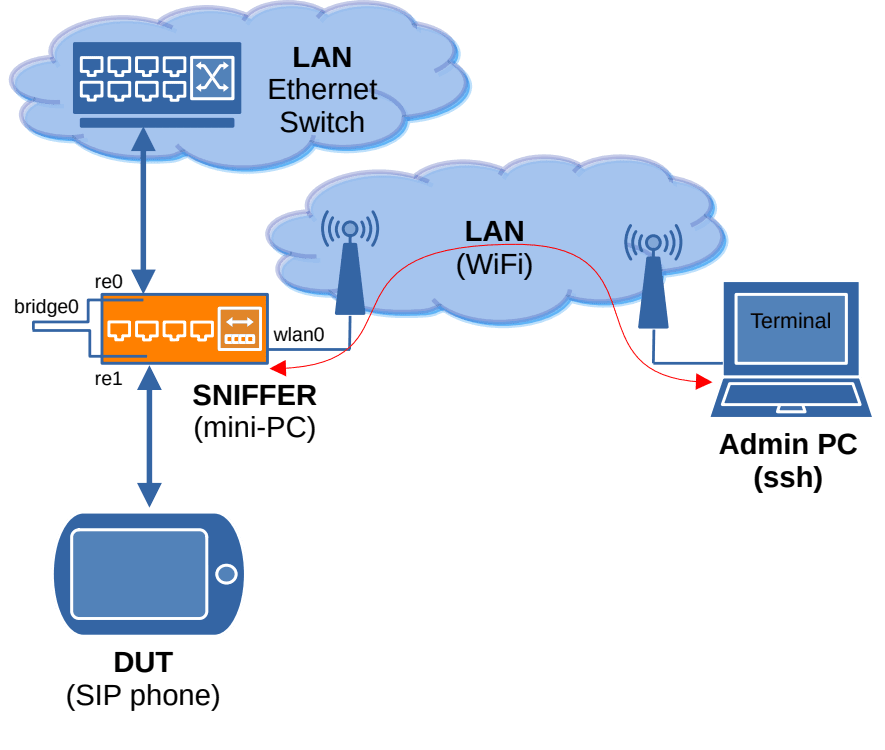
To connect to the sniffer, you need a working PC connected to the same WiFi network as the sniffer, as well as knowledge of the IP address that is issued to the sniffer by the DHCP server. If this is a home network or an enterprise network, then finding out the IP of the sniffer is not difficult – just look in the DHCP server log or view the list of connected MAC addresses on the home WiFi router and find the MAC address of the sniffer’s WiFi port there (the ifconfig wlan0 command is entered in advance). Connecting to the sniffer via SSH is done with the ssh sniffer@xxxx command, where xxxx is the local IP address of the sniffer.
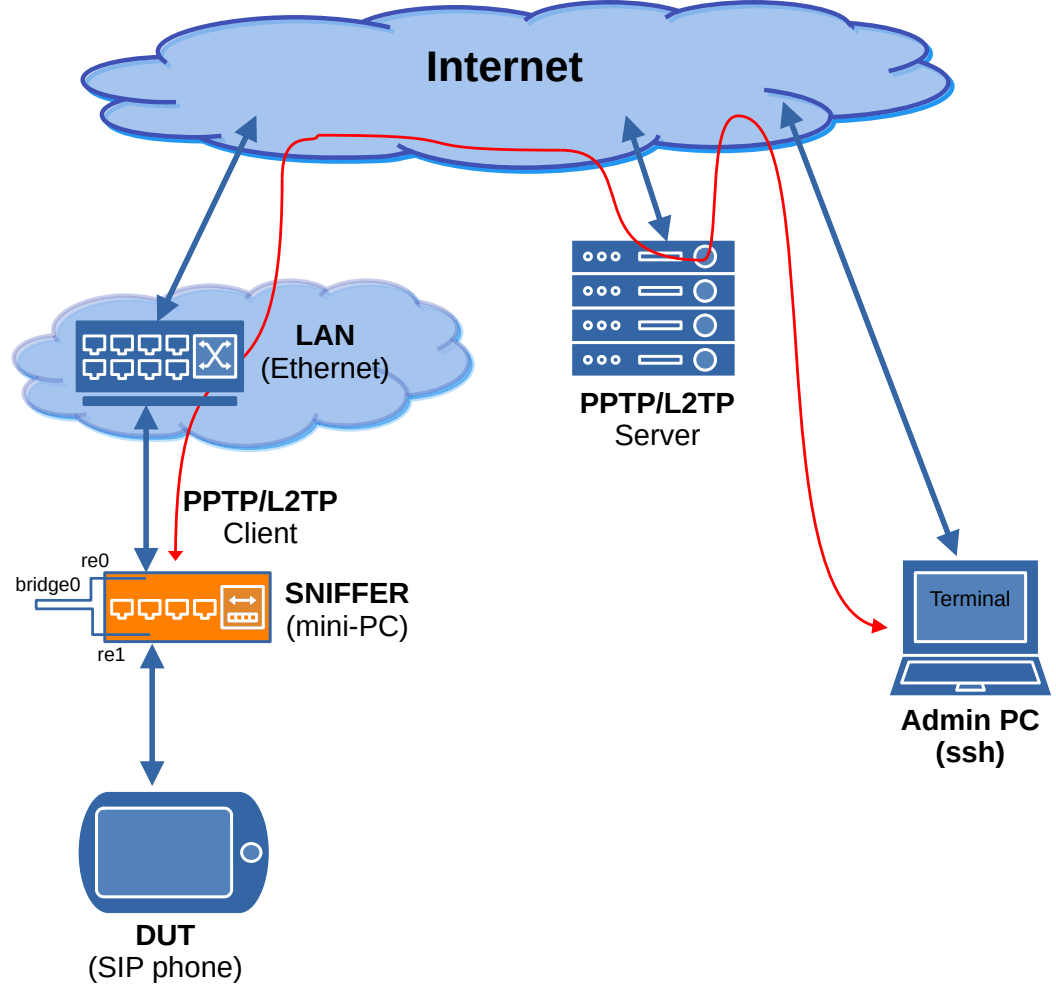
Fig. 8b shows, in essence, the same scheme for enabling the sniffer between the DUT and the local network switch, but the control channel is organized via the global Internet network through a tunnel to the PPTP/L2TP server. In order for the sniffer to be able to establish a tunnel to a given server, it is necessary that a) the sniffer is issued a local IP address via DHCP, and b) that this IP has access to the Internet. If these conditions are met, the sniffer will raise the internal network interface bridge0 during boot and receive an IP address via DHCP. Then the mpd5 utility will come into effect, which will automatically raise the PPTP/L2TP tunnel, obtaining an IP for it that is accessible for connection from the outside. In this case, we use this second IP to access the SSH sniffer. It is important that the provider providing the PPTP/L2TP service issues an IP address that is globally routable, otherwise it will not be possible to reach the sniffer.
It often happens that the user’s network has a connection to the global network (with the network of the Internet access service provider) via the Ethernet port. In this case, the sniffer can be enabled between the local network and the Internet provider’s network, as shown in Fig. 8c. To organize a sniffer control channel, you need a separate account on the PPPoE server of the Internet provider that provides the connection.
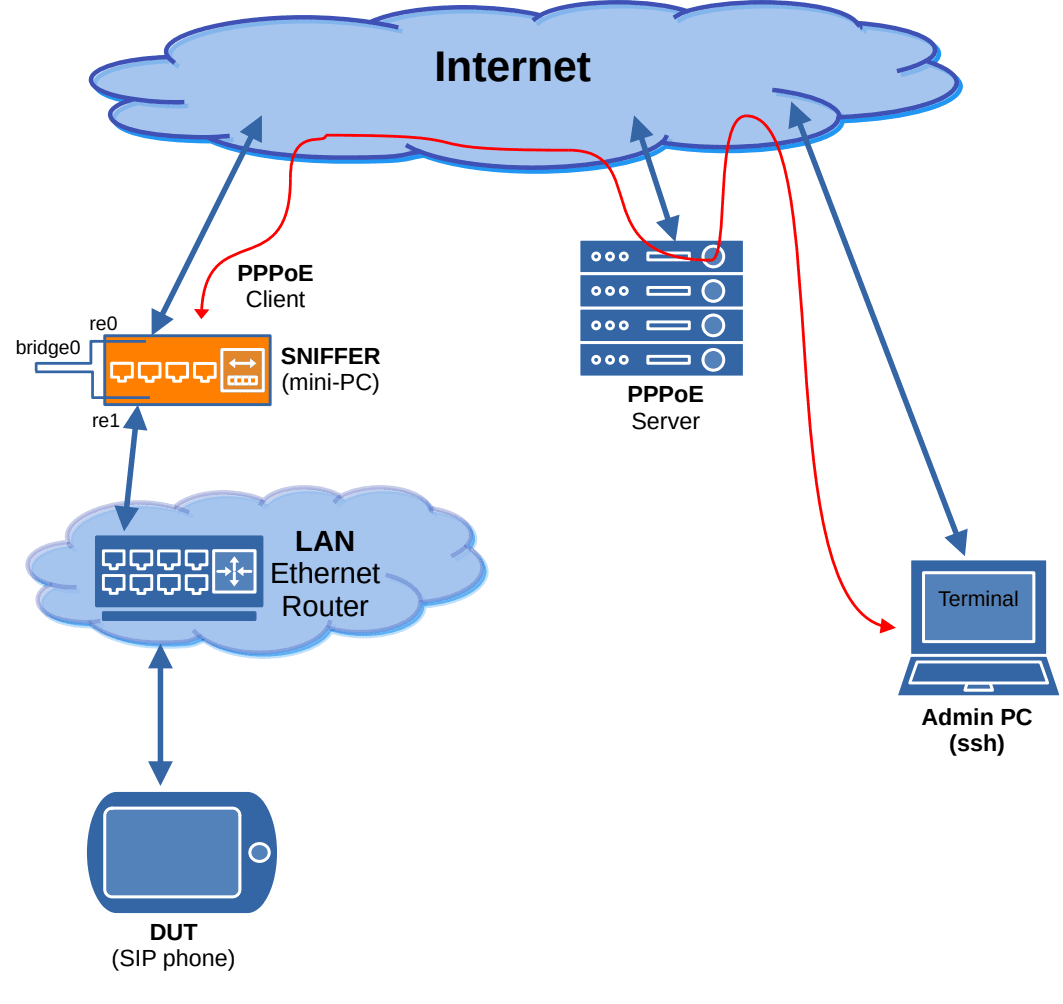
Similar to the previous option, the sniffer will automatically establish a tunnel via PPPoE connection to the provider’s server and provide itself with a globally routable IP address to establish an SSH connection to it.
It is important that in such a switching scheme, all user network traffic will pass through the sniffer, which may create problems with its analysis or a large load on the sniffer. For analysis in such a scheme, use rules that limit traffic only to the IP address of the device under analysis. It is also important to note that local traffic generated by the DUT will not pass through the sniffer and will be excluded from analysis, i.e. in this case, only global traffic between the DUT and hosts on the Internet can be examined.
And the last option for the switching scheme, shown in Fig. 8g, allows you to enable a sniffer in a home network that has a connection to the provider’s network via an optical channel (usually GPON). The sniffer is installed in the cut between the ONU (optical terminal device) and the home router. When the sniffer is enabled in this way, only that part of the user’s traffic that goes to and comes from the global network will be available.
The control channel is also organized via the provider’s PPPoE server. But in general, no one forbids connecting the sniffer to the local (home) WiFi, and through it, if necessary, to have remote control, to raise a PPTP/L2TP tunnel to a public server, as in the previous two options.
If you decide to explore your home network, you just need to connect the sniffer as shown in this diagram and manage it locally via your home WiFi network, connecting via SSH directly.
The network traffic filtering mechanism is designed to allow the user (application) to select (capture) and analyze only the type of traffic of interest, traffic between specific hosts or even ports within a host. The BPF filtering mechanism is built into the FreeBSD OS, so to speak, out of the box. This means that there is a system manual page for it.
Let’s enter the man command with the bpf parameter and briefly familiarize ourselves with the contents of the BPF manual page:
sniffer@sniffer:~ % man bpf
BPF(4)                 FreeBSD Kernel Interfaces Manual                 BPF(4)

NAME
     bpf – Berkeley Packet Filter

SYNOPSIS
     device bpf

DESCRIPTION
     The Berkeley Packet Filter provides a raw interface to data link layers
     in a protocol independent fashion.  All packets on the network, even
     those destined for other hosts, are accessible through this mechanism.

     The packet filter appears as a character special device, /dev/bpf.  After
     opening the device, the file descriptor must be bound to a specific
     network interface with the BIOCSETIF ioctl.  A given interface can be
     shared by multiple listeners, and the filter underlying each descriptor
     will see an identical packet stream.
From the second paragraph we learn that access to BPF is carried out through a special file-device /dev/bpf. Let’s see who has access to this file using the ls utility, enter the command:
niffer@sniffer:~ % ls -al /dev/bpf*
crw-------  1 root wheel 0x27 Jul 10 18:38 /dev/bpf
lrwxr-xr-x  1 root wheel      3 Jul 10 18:20 /dev/bpf0 -> bpf
It can be seen that the device file /dev/bpf and its symbolic link /dev/bpf0 belong to the group wheel, while the group does not have access to this file (there is a dash in the corresponding field: –). This means that only a user with administrator privileges can access BPF, which means we will always have to use the sudo utility. This is very convenient if you use it frequently. Therefore, let’s change the ownership and access rights to /dev/bpf by entering the following commands:
sniffer@sniffer:~ % sudo chmod g+w /dev/bpf
sniffer@sniffer:~ % sudo chgrp network /dev/bpf
See how the attributes and ownership of this file have changed:
sniffer@sniffer:~ % ls -al /dev/bpf
crw-rw----  1 root network 0x27 Jul 10 18:38 /dev/bpf
Now any user in the network group can read and write (rw) to this device file, which means that we no longer need to use sudo to access BPF (recall that the sniffer user, under which we connect to the system, is a member of the network group).
There is a small aspect here. After rebooting the operating system, the access rights to this file will return to their original form, which is not at all what we expect. There is a system mechanism devfs that monitors and changes access rights to system files, with which we can set access rights to individual devices as we need. Let’s add, using the ee editor, to the /etc/devfs.conf configuration file the following two rules for bpf:
sniffer@sniffer:~ % sudo ee /etc/devfs.conf
Copy the following lines to the clipboard:
own  bpf* root:network
perm bpf* 0660
and place them in a file. Exit the editor with the changes saved. Now, at the time of loading the operating system, devfs will set the necessary access rights to BPF and we will be able to use various utilities for traffic analysis without calling the sudo utility.
I must say right away that the topic of BPF (Berkeley Packet Filter) is quite large, dating back to the 1980s to machines and systems manufactured by Digital Equipment Corporation, and may require writing a separate multi-page publication. Strictly speaking, BPF is a virtual machine inside the kernel of the operating system, with its own command system (its own instructions) and its own data formats. Programs for the filter mechanism (Filter Machine) are compiled from these instructions, similar to how a program for the central processor is compiled from machine codes. Running inside the operating system kernel, BPF programs can not only analyze and filter network traffic, but also modify it (substitute and replace data in packets “on the fly”), which makes BPF a very powerful and important mechanism for organizing security systems, detecting and automatically passive and active countering intrusions. BPF allows you to build very complex firewalls, and the FreeBSD and OpenBSD operating systems, with BPF on board, are widely used in industrial products and network security systems. But that’s not what we’re talking about now.
If we continue reading the BPF manual ( man bpf ), we will see that part of it describes the programming mechanisms (API) in the C language and the principles of creating BPF programs from user and system applications. This is not exactly what we need, because we are not going to develop our own programs, but want to use existing ones. There is a special library libpcap (PCAP), which is used by many utilities for capturing, analyzing and filtering network traffic. This library provides programs with a unified interface to BPF based on text rules that are understandable to the end user, which allows you to use BPF without additional programming. A description of the language syntax for creating BPF filter rules can be found on a separate page of the system manual using the man pcap-filter command. Let’s briefly familiarize ourselves with at least the first page of this manual:
sniffer@sniffer:~ % man pcap-filter

PCAP-FILTER(7)     FreeBSD Miscellaneous Information Manual     PCAP-FILTER(7)

NAME
       pcap-filter - packet filter syntax

DESCRIPTION
       pcap_compile(3) is used to compile a string into a filter program.  The
       resulting filter program can then be applied to some stream of packets
       to determine which packets will be supplied to pcap_loop(3),
       pcap_dispatch(3), pcap_next(3), or pcap_next_ex(3).

       The filter expression consists of one or more primitives.  Primitives
       usually consist of an id (name or number) preceded by one or more
       qualifiers.  There are three different kinds of qualifier:

       type   type qualifiers say what kind of thing the id name or number
              refers to.  Possible types are host, net, port and portrange.
              E.g., `host foo', `net 128.3', `port 20', `portrange 6000-6008'.
              If there is no type qualifier, host is assumed.

       dir    dir qualifiers specify a particular transfer direction to and/or
              from id.  Possible directions are src, dst, src or dst, src and
              dst, ra, ta, addr1, addr2, addr3, and addr4.  E.g., `src foo',
              `dst net 128.3', `src or dst port ftp-data'.  If there is no dir
              qualifier, `src or dst' is assumed.  The ra, ta, addr1, addr2,
              addr3, and addr4 qualifiers are only valid for IEEE 802.11
              Wireless LAN link layers.

       proto  proto qualifiers restrict the match to a particular protocol.
              Possible protocols are: ether, fddi, tr, wlan, ip, ip6, arp,
              rarp, decnet, sctp, tcp and udp.  E.g., `ether src foo', `arp
              net 128.3', `tcp port 21', `udp portrange 7000-7009', `wlan
              addr2 0:2:3:4:5:6'.  If there is no proto qualifier, all
              protocols consistent with the type are assumed.  E.g., `src foo'
              means `(ip6 or ip or arp or rarp) src foo', `net bar' means `(ip
              or arp or rarp) net bar' and `port 53' means `(tcp or udp or
              sctp) port 53' (note that these examples use invalid syntax to
              illustrate the principle).
And a little further:
Primitives may be combined using:

              A parenthesized group of primitives and operators.

              Negation (`!' or `not').

              Concatenation (`&&' or `and').

              Alternation (`||' or `or').

       Negation has the highest precedence.  Alternation and concatenation
       have equal precedence and associate left to right.

       If an identifier is given without a keyword, the most recent keyword is
       assumed.  For example,
            not host vs and ace
       is short for
            not host vs and host ace
       which should not be confused with
            not (host vs or ace)
This quote from the manual contains the maximum of knowledge that we need to build complex filters. If we briefly summarize what was said in the manual, the filtering rules look like this:
1. A primitive rule consists of three parts: type dir proto where: type – specifies the type of entity that is defined further in the rule, it can be host, net, port or portrange. dir – determines which of the packet fields will be analyzed: src, dst, addr1, addr2, etc. proto – indicates which packets belonging to which protocol will match this rule: icmp, tcp, udp, etc. (there are a lot of them). 2. Any part of the rule may be missing, which is equivalent to the expression (“any”). That is, if proto is missing, then packets of all protocols will be analyzed.
3. Primitive rules can be combined into more complex rules using the logical operations or, and, and not, as well as a nested system of parentheses. Logical operations can be expressed by the signs: || , && or !
For clarity, let’s look at a few simple examples:
The one-word rule icmp will create a filter that only describes Internet Control and Management Protocol (ICMP), i.e. packets generated by ping requests and responses. We have already used this rule to test the network bridge in Section 5.3.
Rule: udp 5060 will create a filter that will cover UDP traffic only for ports 5060 (in both directions). This is the simplest rule for separating SIP packets from the general network traffic flow.
Rule: not port 22 will create a filter that will exclude from the captured traffic all packets (TCP and UDP) with port number 22 in the destination or source. This is the simplest rule for subtracting (removing from analysis) traffic generated by the SSH remote access protocol. This is a very useful rule to use when you need to look at all network traffic, but remote host management (SSH) traffic can clog the output with a giant stream of useless information. This is where this rule comes in handy.
Rule: dst host 192.168.168.14 will create a filter that will select the flow of packets in the destination IP address field of which the specified host is specified. Using this rule, you can spy on traffic directed towards host 192.168.168.14.
Rule: vlan 2 will select all Ethernet packets of type 0x8100 in which the VLAN tag is 2.
A slightly more complex rule: vlan 4 and dst host 192.168.168.14 and not port 22 will select traffic for VLAN = 2 and only towards host 192.168.168.14 will remove SSH protocol traffic (port 22) from the sample so as not to mix.
BPF has mechanisms to not only look at packet headers, but also look deeper into the packet data (payload). Such deep packet analysis rules are commonly called Deep Packet Inspection (DPI). Below are some examples of DPI rules:
The rule: ‘udp[8:4] = 0x5349502f && udp[12:4] = 0x322e3020’ will allow you to select from the stream only UDP packets that contain at the very beginning of the payload block (at the beginning of the payload) the string of characters: “ SIP/2.0 “ (including the space), including the space. A packet with such content is a response to SIP/2.0 protocol requests. Such a rule can be useful in the case when a proprietary program tries to “hide” the SIP protocol exchange by choosing a random UDP port number.
A more complex rule with feedback: ‘tcp[((tcp[12:1] & 0xf0) >> 2):4] = 0x5353482d’ will allow you to detect all attempts to establish an SSH protocol connection regardless of which TCP port this service is located on. Such a rule can be very useful for detecting SSH port scans by malware or intrusion attempts.
How it works, most likely, has already become clear. The first rule selects two values of 4 bytes from the UDP packet, represents them as a number and compares them with the specified constants. The number 8 in the rule udp[8:4] specifies an offset of 8 bytes relative to the beginning of the UDP header, and the number 4 indicates that four bytes should be taken for comparison. The constant 0x5349502f is the text string “SIP/” in ASCII code, and 0x322e3020 is the text string ” 2.0″ along with a space.
The second rule is much more complicated. It is aimed at analyzing the content of the payload of TCP packets. There is some complexity with TCP packets – their header has a variable length, which means that getting to the payload simply by specifying an offset will not work. For such cases, you can use the BPF feature, which allows you to calculate the value of a variable based on the data and use its value as an offset to obtain another value, which will already be compared with the constant. In the example above, the rule fragment ((tcp[12:1] & 0xf0) >> 2) itself calculates the length of the header, i.e., obtains the offset of the zero byte of the payload. Then this value is substituted as an index (offset) and another four-byte value is selected to check for coincidence with the constant 0x5353482d, similar to the case with UDP.
Next, we will try to apply these rules in the operation of a live network.
DPI rules for traffic analysis create a very large load on the computing system, especially during intense traffic flow. Using several such rules with an average network load can easily “hang” the system on the sniffer or even send the kernel to panic, so you need to act carefully – it is advisable to add exceptions for unnecessary (we are obviously not interested in) traffic using primitive rules such as src host , tcp port . Now it is clear why we conducted Coremark and STREAM performance tests? 😉
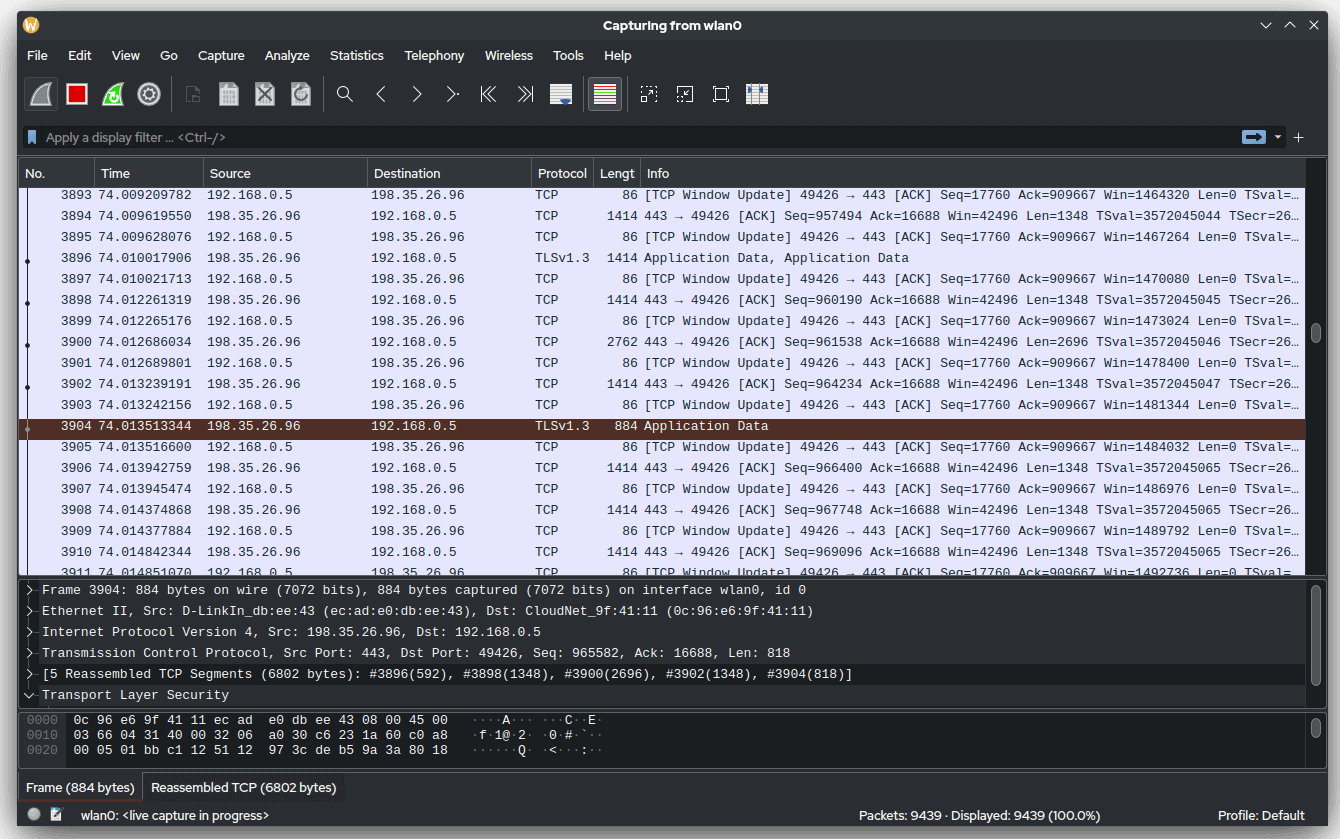
It is time to get acquainted with another powerful network traffic analysis utility – WireShark . This utility is probably familiar to many network engineers and administrators, including in the Windows environment. WireShark has a convenient graphical interface that allows not only to capture (record) and display individual packets, but also to perform in-depth analysis of recorded traffic with several passes. WireShark is able to automatically divide all traffic into associated flows between endpoints (host:port pairs), allows you to unwind TCP chains and extract a sequential stream of transmitted useful data from the entire volume of packets. In other words, WireShark is able to spy on and extract data transmitted by a user application from the stream. WireShark has flexible search tools for the recorded volume of data and filtering based on BPF. Fig. 9 below shows the WireShark graphical interface window under Linux.
However, few network engineers know about the existence of a “console” version of WireShark, or rather, a version of the same utility designed for a text terminal. This utility is called tshark. It is part of the same software package with the general name WireShark and uses the same backend as its graphical counterpart.
The tshark utility has a rich set of command-line options and parameters, but its general approach is the same as that of the tcpdump utility – a set of options is followed by a set of BPF rules, with one exception – the syntax of these rules is much richer. For example, in tshark you can specify a rule of the form ‘http.request.method == “GET”‘ to receive only packets with HTTP requests. Such a rule also belongs to the DPI class and inside the utility it is represented as a combination of more primitive BPF rules. It is more convenient to use the tshark utility instead of the tcpdump utility when you need to perform a deep analysis of the payload transmitted over the network.
tshark has its own system manual page, which can be called with the man tshark command. I suggest you familiarize yourself with it:
sniffer@sniffer:~ % man tshark

TSHARK(1)                                                            TSHARK(1)

NAME
       tshark - Dump and analyze network traffic

SYNOPSIS
       tshark [ -i <capture interface>|- ] [ -f <capture filter> ] [ -2 ]
       [ -r <infile> ] [ -w <outfile>|- ] [ options ] [ <filter> ]

       tshark -G [ <report type> ] [ --elastic-mapping-filter <protocols> ]
       [ -C <profile> ]

       tshark -h|--help

       tshark -v|--version

DESCRIPTION
       TShark is a network protocol analyzer.  It lets you capture packet data
       from a live network, or read packets from a previously saved capture
       file, either printing a decoded form of those packets to the standard
       output or writing the packets to a file.  TShark's native capture file
       format is pcapng format, which is also the format used by Wireshark and
       various other tools.

       Without any options set, TShark will work much like tcpdump.  It will
       use the pcap library to capture traffic from the first available
       network interface and displays a summary line on the standard output
       for each received packet.

    ...
The manual says that tshark (developers prefer to write the name in uppercase – TShark) in many cases behaves similarly to the tcpdump utility, and this is very convenient, because many Unix system administrators are used to the tcpdump utility and its set of parameters. tshark is very similar to tcpdump in terms of naming options and compiling rules.
Let’s move from words to action – let’s test the DPI rules given in the previous section in both utilities. To do this, connect a sniffer to the interface between the IP video intercom and the network, in the same way as was described in section 5.3 with the passing of office MFP traffic.
It should be noted that when specifying complex rules on the command line, they should be enclosed in single quotes, otherwise the tcsh shell can interpret the symbols of logical operations and brackets at its own discretion and we may get a completely different result.
Call the tcpdump utility and pass it the following BPF rule for deep traffic analysis:
sniffer@sniffer:~ % tcpdump -n -i bridge0 -s 1500 -X -vv 'udp[8:4] = 0x5349502f && udp[12:4] = 0x322e3020'
In a few seconds we will see the first packets exchanged between the IP intercom and the SIP proxy server. Let me remind you that this complex rule analyzes the contents of the UDP packet payload in order to identify and capture SIP response packets (for our convenience, they contain the SIP/2.0 string at the very beginning of the payload). This rule does not respond to SIP requests! One of such “captured” responses will look like this:
tcpdump: listening on bridge0, link-type EN10MB (Ethernet), snapshot length 1500 bytes
00:26:23.478943 IP (tos 0x68, ttl 254, id 375, offset 0, flags [none], proto UDP (17), length 412)
    72.243.211.106.53520 > 192.168.168.139.5060: [udp sum ok] SIP, length: 384
        SIP/2.0 100 Trying
        Via: SIP/2.0/UDP 192.168.168.139:5060;branch=z9hG4bK-gdklpgig931861861291050861291.b;rport
        0x0000:  4568 019c 0177 0000 fe11 92e1 4df2 6f6a  Eh...w......M.oj
        0x0010:  c0a8 a88b d110 13c4 0188 5447 5349 502f  ..........TGSIP/
        0x0020:  322e 3020 3130 3020 5472 7969 6e67 0d0a  2.0.100.Trying..
        0x0030:  5669 613a 2053 4950 2f32 2e30 2f55 4450  Via:.SIP/2.0/UDP
        0x0040:  2031 3932 2e31 3638 2e31 3638 2e31 3339  .192.168.168.139
        0x0050:  3a35 3036 303b 6272 616e 6368 3d7a 3968  :5060;branch=z9h
        0x0060:  4734 624b 2d67 646b 6c70 6769 6739 3331  G4bK-gdklpgig931
        0x0070:  3836 3138 3631 3239 3130 3530 3836 3132  8618612910508612
        0x0080:  3931 2e62 3b72 706f 7274 0d0a 4672 6f6d  91.b;rport..From
        0x0090:  3a20 22d0 94d0 bed0 bcd0 bed1 84d0 bed0  :.".............
        0x00a0:  bd22 203c 7369 703a 3230 3140 6661 626d  .".<sip:201@exam
        0x00b0:  6963 726f 2e72 753e 3b74 6167 3d46 726f  ples.xx>;tag=Fro
        0x00c0:  6d54 6167 2d67 646b 6c70 6769 6739 3331  mTag-gdklpgig931
        0x00d0:  3836 3138 3631 3239 3130 3530 3836 3132  8618612910508612
        0x00e0:  3931 2e62 0d0a 546f 3a20 3c73 6970 3a32  91.b..To:.<sip:2
        0x00f0:  3031 4066 6162 6d69 6372 6f2e 7275 3e0d  [email protected]>.
        0x0100:  0a44 6174 653a 2054 6875 2c20 3130 204a  .Date:.Thu,.10.J
        0x0110:  756c 2032 3032 3520 3136 3a33 323a 3235  ul.2025.16:32:25
        0x0120:  2047 4d54 0d0a 4361 6c6c 2d49 443a 2067  .GMT..Call-ID:.g
        0x0130:  646b 6c70 6769 6739 3331 3836 3138 3631  dklpgig931861861
        0x0140:  3239 3130 3530 3836 3132 3931 2e62 0d0a  291050861291.b..
        0x0150:  5365 7276 6572 3a20 4369 7363 6f2d 5349  Server:.Cisco-SI
        0x0160:  5047 6174 6577 6179 2f49 4f53 2d31 322e  PGateway/IOS-12.
        0x0170:  780d 0a43 5365 713a 2032 3833 2052 4547  x..CSeq:.283.REG
        0x0180:  4953 5445 520d 0a43 6f6e 7465 6e74 2d4c  ISTER..Content-L
        0x0190:  656e 6774 683a 2030 0d0a 0d0a            ength:.0....
SIP protocol exchange is usually not encrypted, that is, it is transmitted in plain text, so by the content of the packet we can accurately determine that we have a response “SIP/2.0 100 Trying” from a SIP proxy with the address 72.243.211.106 to the request “REGISTER. In the text of the packet, those bytes (that is, a piece of the payload block) that the rule caught are highlighted in bold. Obviously, if you have an idea of the payload format, it is not difficult to compose a BPF rule in order to grab any packets interesting for analysis from the stream. But only if this data was not transmitted in encrypted form. 🙂
sniffer@sniffer:~ % tshark -n -i bridge0 -s 1500 -V 'udp[8:4] = 0x5349502f && udp[12:4] = 0x322e3020'
Let’s do the same trick, but using the `tshark’ utility. The command format is very similar to the one we just used for the `tcpdump’ utility:
On the first match, we will get the following message from `tshark’ in the terminal:
Capturing on 'bridge0'
Frame 1: 426 bytes on wire (3408 bits), 426 bytes captured (3408 bits) on interface bridge0, id 0
    Section number: 1
    Interface id: 0 (bridge0)
        Interface name: bridge0
    Encapsulation type: Ethernet (1)
    Arrival Time: Jul 11, 2025 00:54:19.286236877 +05
    UTC Arrival Time: Jul 10, 2025 19:54:19.286236877 UTC
    Epoch Arrival Time: 1752177259.286236877
    [Time shift for this packet: 0.000000000 seconds]
    [Time delta from previous captured frame: 0.000000000 seconds]
    [Time delta from previous displayed frame: 0.000000000 seconds]
    [Time since reference or first frame: 0.000000000 seconds]
    Frame Number: 1
    Frame Length: 426 bytes (3408 bits)
    Capture Length: 426 bytes (3408 bits)
    [Frame is marked: False]
    [Frame is ignored: False]
    [Protocols in frame: eth:ethertype:ip:udp:sip]
Ethernet II, Src: e8:39:35:b1:10:ee, Dst: fe:4a:eb:ea:b4:61
    Destination: fe:4a:eb:ea:b4:61
        .... ..1. .... .... .... .... = LG bit: Locally administered address (this is NOT the factory default)
        .... ...0 .... .... .... .... = IG bit: Individual address (unicast)
    Source: e8:39:35:b1:10:ee
        .... ..0. .... .... .... .... = LG bit: Globally unique address (factory default)
        .... ...0 .... .... .... .... = IG bit: Individual address (unicast)
    Type: IPv4 (0x0800)
    [Stream index: 0]
Internet Protocol Version 4, Src: 72.243.211.106, Dst: 192.168.168.139
    0100 .... = Version: 4
    .... 0101 = Header Length: 20 bytes (5)
    Differentiated Services Field: 0x68 (DSCP: AF31, ECN: Not-ECT)
        0110 10.. = Differentiated Services Codepoint: Assured Forwarding 31 (26)
        .... ..00 = Explicit Congestion Notification: Not ECN-Capable Transport (0)
    Total Length: 412
    Identification: 0x01a9 (425)
    000. .... = Flags: 0x0
        0... .... = Reserved bit: Not set
        .0.. .... = Don't fragment: Not set
        ..0. .... = More fragments: Not set
    ...0 0000 0000 0000 = Fragment Offset: 0
    Time to Live: 254
    Protocol: UDP (17)
    Header Checksum: 0x92af [validation disabled]
    [Header checksum status: Unverified]
    Source Address: 72.243.211.106
    Destination Address: 192.168.168.139
    [Stream index: 0]
User Datagram Protocol, Src Port: 53520, Dst Port: 5060
    Source Port: 53520
    Destination Port: 5060
    Length: 392
    Checksum: 0x5e47 [unverified]
    [Checksum Status: Unverified]
    [Stream index: 0]
    [Stream Packet Number: 1]
    [Timestamps]
        [Time since first frame: 0.000000000 seconds]
        [Time since previous frame: 0.000000000 seconds]
    UDP payload (384 bytes)
Session Initiation Protocol (100)
    Status-Line: SIP/2.0 100 Trying
        Status-Code: 100
        [Resent Packet: False]
    Message Header
        Via: SIP/2.0/UDP 192.168.168.139:5060;branch=z9hG4bK-gdklpgig931861861291050861291.b;rport
            Transport: UDP
            Sent-by Address: 192.168.168.139
            Sent-by port: 5060
            Branch: z9hG4bK-gdklpgig931861861291050861291.b
            RPort: rport
        From: "Домофон" <sip:[email protected]>;tag=FromTag-gdklpgig931861861291050861291.b
            SIP from display info: "Домофон"
            SIP from address: sip:[email protected]
                SIP from address User Part: 201
                SIP from address Host Part: samples.xx
            SIP from tag: FromTag-gdklpgig931861861291050861291.b
        To: <sip:[email protected]>
            SIP to address: sip:[email protected]
                SIP to address User Part: 201
                SIP to address Host Part: samples.xx
        Date: Thu, 10 Jul 2025 17:00:21 GMT
        Call-ID: gdklpgig931861861291050861291.b
        [Generated Call-ID: gdklpgig931861861291050861291.b]
        Server: Cisco-SIPGateway/IOS-12.x
        CSeq: 308 REGISTER
            Sequence Number: 308
            Method: REGISTER
        Content-Length: 0
The output in tshark will be much richer. For each packet, this utility produces the following analysis:
Ethernet II (MAC) header analysis;
Internet Protocol (IP) header analysis;
User Datagram Protocol (UDP) header analysis;
and Session Initiation Protocol (SIP) packet analysis.
The tshark utility will try to analyze literally every bit of the captured packet and output the maximum information it has. From the above listing, we can see that tshark has accurately determined that this is a SIP packet containing a response to the “REGISTER” request and has perfectly described the contents of each field to us.
It is worth noting that the tcpdump utility also performs some analysis (parsing) of MAC and IP headers, but it is not capable of performing SIP analysis. Although it is possible to display the contents of a SIP packet in text form.
Now let’s try a more complex (second) rule and see how both utilities handle it. Recall that this rule first finds the location of the payload in the TCP packet, and then tries to detect the string of text SSH_ at the very beginning, which is a sign of an SSH handshake.
First, let’s run the utility tcpdump with the following parameters:
sniffer@sniffer:~ % tcpdump -n -i bridge0 -s 1500 -X -vv 'tcp[((tcp[12:1] & 0xf0) >> 2):4] = 0x5353482d'
Next, another terminal window opens on the work PC, after which an attempt is made to establish an SSH connection to the IP intercom, which runs at 192.168.168.139 – this information was determined during the previous stage. The intercom must have the sshd daemon running on port 22/tcp in advance, otherwise it will be impossible to establish a connection.
I execute the following command on the work PC:
rz@butterfly:~ % ssh [email protected]
And then I see the following message from tcpdump in the sniffer terminal, containing a dump of the “caught” packet:
tcpdump: listening on bridge0, link-type EN10MB (Ethernet), snapshot length 1500 bytes
00:25:10.212128 IP (tos 0x48, ttl 63, id 0, offset 0, flags [DF], proto TCP (6), length 90)
    192.168.176.155.37196 > 192.168.168.139.22: Flags [P.], cksum 0x63d4 (correct), seq 3500301681:3500301719, ack 2008447800, win 257, options [nop,nop,TS val 2915515975 ecr 962763132], length 38: SSH: SSH-2.0-OpenSSH_9.9 FreeBSD-20250219
        0x0000:  4548 005a 0000 4000 3f06 60de c0a8 b09b  EH.Z..@.?.`.....
        0x0010:  c0a8 a88b 914c 0016 d0a2 5d71 77b6 7b38  .....L....]qw.{8
        0x0020:  8018 0101 63d4 0000 0101 080a adc7 3e47  ....c.........>G
        0x0030:  3962 997c 5353 482d 322e 302d 4f70 656e  9b.|SSH-2.0-Open
        0x0040:  5353 485f 392e 3920 4672 6565 4253 442d  SSH_9.9.FreeBSD-
        0x0050:  3230 3235 3032 3139 0d0a                 20250219..
In this example, tcpdump successfully filtered a TCP packet from the general stream, guided by the contents of the payload. Just like in the previous experiment, the bytes that meet the filtering condition and match the specified rule are highlighted.
From the contents of the packet, it can be seen that the ssh client is part of the OpenSSH package and runs on FreeBSD, and the line contains the date of the client’s compilation, and you can even guess some version. So, by looking at just one packet, you can already learn quite a lot about the user. 🙂
Let’s test this rule with the tshark utility by entering the following command:
sniffer@sniffer:~ % tshark -n -i bridge0 -s 1500 -V 'tcp[((tcp[12:1] & 0xf0) >> 2):4] = 0x5353482d'
and try to connect to the IP intercom via SSH in the same way as in the previous experiment. In the sniffer terminal window, we will immediately receive a long listing with the analysis of the TCP packet from tshark:
Capturing on 'bridge0'
Frame 1: 104 bytes on wire (832 bits), 104 bytes captured (832 bits) on interface bridge0, id 0
    Section number: 1
    Interface id: 0 (bridge0)
        Interface name: bridge0
    Encapsulation type: Ethernet (1)
    Arrival Time: Jul 11, 2025 00:36:25.038883854 +05
    UTC Arrival Time: Jul 10, 2025 19:36:25.038883854 UTC
    Epoch Arrival Time: 1752176185.038883854
    [Time shift for this packet: 0.000000000 seconds]
    [Time delta from previous captured frame: 0.000000000 seconds]
    [Time delta from previous displayed frame: 0.000000000 seconds]
    [Time since reference or first frame: 0.000000000 seconds]
    Frame Number: 1
    Frame Length: 104 bytes (832 bits)
    Capture Length: 104 bytes (832 bits)
    [Frame is marked: False]
    [Frame is ignored: False]
    [Protocols in frame: eth:ethertype:ip:tcp:ssh]
Ethernet II, Src: e8:39:35:b1:10:ee, Dst: fe:4a:eb:ea:b4:61
    Destination: fe:4a:eb:ea:b4:61
        .... ..1. .... .... .... .... = LG bit: Locally administered address (this is NOT the factory default)
        .... ...0 .... .... .... .... = IG bit: Individual address (unicast)
    Source: e8:39:35:b1:10:ee
        .... ..0. .... .... .... .... = LG bit: Globally unique address (factory default)
        .... ...0 .... .... .... .... = IG bit: Individual address (unicast)
    Type: IPv4 (0x0800)
    [Stream index: 0]
Internet Protocol Version 4, Src: 192.168.176.155, Dst: 192.168.168.139
    0100 .... = Version: 4
    .... 0101 = Header Length: 20 bytes (5)
    Differentiated Services Field: 0x48 (DSCP: AF21, ECN: Not-ECT)
        0100 10.. = Differentiated Services Codepoint: Assured Forwarding 21 (18)
        .... ..00 = Explicit Congestion Notification: Not ECN-Capable Transport (0)
    Total Length: 90
    Identification: 0x0000 (0)
    010. .... = Flags: 0x2, Don't fragment
        0... .... = Reserved bit: Not set
        .1.. .... = Don't fragment: Set
        ..0. .... = More fragments: Not set
    ...0 0000 0000 0000 = Fragment Offset: 0
    Time to Live: 63
    Protocol: TCP (6)
    Header Checksum: 0x60de [validation disabled]
    [Header checksum status: Unverified]
    Source Address: 192.168.176.155
    Destination Address: 192.168.168.139
    [Stream index: 0]
Transmission Control Protocol, Src Port: 45404, Dst Port: 22, Seq: 1, Ack: 1, Len: 38
    Source Port: 45404
    Destination Port: 22
    [Stream index: 0]
    [Stream Packet Number: 1]
    [Conversation completeness: Incomplete (0)]
        ..0. .... = RST: Absent
        ...0 .... = FIN: Absent
        .... 0... = Data: Absent
        .... .0.. = ACK: Absent
        .... ..0. = SYN-ACK: Absent
        .... ...0 = SYN: Absent
        [Completeness Flags: [ Null ]]
    [TCP Segment Len: 38]
    Sequence Number: 1    (relative sequence number)
    Sequence Number (raw): 2043450806
    [Next Sequence Number: 39    (relative sequence number)]
    Acknowledgment Number: 1    (relative ack number)
    Acknowledgment number (raw): 2021031524
    1000 .... = Header Length: 32 bytes (8)
    Flags: 0x018 (PSH, ACK)
        000. .... .... = Reserved: Not set
        ...0 .... .... = Accurate ECN: Not set
        .... 0... .... = Congestion Window Reduced: Not set
        .... .0.. .... = ECN-Echo: Not set
        .... ..0. .... = Urgent: Not set
        .... ...1 .... = Acknowledgment: Set
        .... .... 1... = Push: Set
        .... .... .0.. = Reset: Not set
        .... .... ..0. = Syn: Not set
        .... .... ...0 = Fin: Not set
        [TCP Flags: ·······AP···]
    Window: 257
    [Calculated window size: 257]
    [Window size scaling factor: -1 (unknown)]
    Checksum: 0x8b83 [unverified]
    [Checksum Status: Unverified]
    Urgent Pointer: 0
    Options: (12 bytes), No-Operation (NOP), No-Operation (NOP), Timestamps
        TCP Option - No-Operation (NOP)
            Kind: No-Operation (1)
        TCP Option - No-Operation (NOP)
            Kind: No-Operation (1)
        TCP Option - Timestamps: TSval 2682966770, TSecr 963437961
            Kind: Time Stamp Option (8)
            Length: 10
            Timestamp value: 2682966770
            Timestamp echo reply: 963437961
    [Timestamps]
        [Time since first frame in this TCP stream: 0.000000000 seconds]
        [Time since previous frame in this TCP stream: 0.000000000 seconds]
    [SEQ/ACK analysis]
        [Bytes in flight: 38]
        [Bytes sent since last PSH flag: 38]
    TCP payload (38 bytes)
SSH Protocol
    Protocol: SSH-2.0-OpenSSH_9.9 FreeBSD-20250219
    [Direction: client-to-server]
Similar to the SIP packet, the tshark utility provided a detailed analysis of the packet, which is part of the SSH handshake, consisting of four sections:
Ethernet II (MAC) header analysis;
Internet Protocol (IP) header analysis;
Transmission Control Protocol (TCP) header analysis;
and SSH Protocol (SSH) packet analysis.
Here is another example that demonstrates the capabilities of the tshark utility to decode a data stream from general traffic. Let’s assume that we have a certain device, the same IP intercom, with a Web admin on board and we need to find out the text of HTTP requests and responses to them, in particular, to spy on the password for authorization (the reasons for this may be purely technical). The sequence of actions is as follows:
First, we will record all HTTP traffic for a given host (192.168.168.139) in a separate file named dump-192.168.168.139.pcap. The recording command looks like this:
sniffer@sniffer:~ % tshark -i bridge0 -w dump-192.168.168.139.pcap port 80
Capturing on 'bridge0'
After launching, the tshark utility starts displaying a counter that continuously increases and displays the number of captured packets. Next, you need to wait for the user to perform several HTTP requests. As part of the experiment, this can be a simple opening of a browser and going to the web admin of the device under test. The tshark utility shows the following:
134 ^C
After switching to the web interface of the device, the counter of captured packets in tshark increases sharply, indicating active HTTP traffic. To end the recording, just press Ctrl-C.
Now we need to see which TCP streams were recorded and display their identifiers (numbers from zero and higher) in order to further decode each stream separately. Since we are only interested in HTTP requests and responses to them, we enter the following command with a filter:
sniffer@sniffer:~ % tshark -n -r dump-192.168.168.139.pcap -2 -R "http.request or http.response" -T fields -e tcp.stream
0
0
1
3
3
1
4
4
The tshark utility gives us the following stream IDs in which it detected HTTP traffic: 0, 1, 3, and 4. Let’s remember them.
Now we can decode the traffic of each stream with the following command, specifying the stream number at the end (the digit 0 after “ascii”):
sniffer@sniffer:~ % tshark -n -r dump-192.168.168.139.pcap -z follow,tcp,ascii,0
The utility outputs the contents of the 0th stream:
===================================================================
Follow: tcp,ascii
Filter: tcp.stream eq 0
Node 0: 192.168.176.155:54742
Node 1: 192.168.168.139:80
378
GET / HTTP/1.1
Host: 192.168.168.139
User-Agent: Mozilla/5.0 (X11; Linux x86_64; rv:128.0) Gecko/20100101 Firefox/128.0
Accept: text/html,application/xhtml+xml,application/xml;q=0.9,*/*;q=0.8
Accept-Language: en-US,en;q=0.5
Accept-Encoding: gzip, deflate
Connection: keep-alive
Upgrade-Insecure-Requests: 1
Priority: u=0, i


        176
HTTP/1.1 200 OK
Access-Control-Allow-Origin: *
Cache-Control: no-cache, no-store, must-revalidate
Pragma: no-cache
Expires: 0
Server: SIPHomePhone/2.0
Content-Type: text/html


        168
<html>
<head><meta http-equiv="refresh" content="0; url=admin_new.cgi"></head>
<body><p>The page has moved to: <a href="admin_new.cgi">this page</a></p></body>
</html>

===================================================================
We see that the Web-admin of this device after the standard request “GET /” redirected the user’s browser to another url=admin_new.cgi. This means that the browser will make another request. Therefore, we decode the following stream, enter the command to decode stream number 1:
sniffer@sniffer:~ % tshark -n -r dump-192.168.168.139.pcap -z follow,tcp,ascii,1
In response, we receive the text of the request and a giant “response” to it:
===================================================================
Follow: tcp,ascii
Filter: tcp.stream eq 1
Node 0: 192.168.176.155:59591
Node 1: 192.168.168.139:80
391
GET /admin_new.cgi HTTP/1.1
Host: 192.168.168.139
User-Agent: Mozilla/5.0 (X11; Linux x86_64; rv:128.0) Gecko/20100101 Firefox/128.0
Accept: text/html,application/xhtml+xml,application/xml;q=0.9,*/*;q=0.8
Accept-Language: en-US,en;q=0.5
Accept-Encoding: gzip, deflate
Authorization: Basic YWRtaW46cGFzc3dvcmQ=
Connection: keep-alive
Upgrade-Insecure-Requests: 1
Priority: u=0, i


        72
HTTP/1.1 200 OK
Access-Control-Allow-Origin: *
Server: SIPHomePhone/2.0

        1385
Content-type: text/html; charset=utf-8

<html>
<head>
<meta charset="utf-8" />
<meta http-equiv="cache-control" content="no-cache"/>
<meta http-equiv="pragma" content="no-cache"/>

<link rel='stylesheet' id='theme-link' href='spectre.min.css'>
<link rel='stylesheet' id='iconlib-link' href='spectre-icons.css'>
<style>
#navbar-fabmicro a:hover {background-color:#f7f7f7;}
.menu-active {font-weight:bold;}

…

</script>
</div>
<hr>
<div class="text-center">{SID: <b>1466511685677080494854530CA38107</b>} {Serial: <b>1659112279</b>} {Source: default_config}</div>
</body>
</html>

===================================================================
Most of the HTML code of the page was removed from the received response, as these elements do not contain valuable information for this experiment. The most interesting part is in the HTTP headers, namely this one:
Authorization: Basic YWRtaW46cGFzc3dvcmQ=
This header indicates that the Web server has asked the client to perform Basic authentication, which means that inside the Base64 encoded string is the username and password in plain text. So, all that remains is to decode this string with the following command:
sniffer@sniffer:~ % echo YWRtaW46cGFzc3dvcmQ= | base64 -d
admin:password
And we immediately find out that the user used the login: admin and password: password . The goal is achieved!
I would like to note that 99% of the traffic transmitted over networks is currently encrypted using various algorithms and protocols (SSL, TLS), so it is simply impossible to eavesdrop on passwords for any user flow in modern realities. The above example is mostly simulated and shown to demonstrate the capabilities of the tshark utility to extract the payload from the traffic flow.
But I also note that this utility has a -o switch with which you can specify the RSA key from the SSL certificate and then tshark will automatically decode and decrypt SSL/TLS traffic. Thus, the task of listening is reduced to where to get the key. 😉
Another useful utility that I would like to talk about is trafshow. This utility was written by our compatriot Vladimir Vorobyov from Novosibirsk State University in the distant 90s of the last century. The utility is still supported and works great on many Unix systems that have the BPF API. It is not included in the standard FreeBSD OS, but is in the repository as a separate package with the same name, that is, you can install it with one command:
sniffer@sniffer:~ % sudo pkg install trafshow
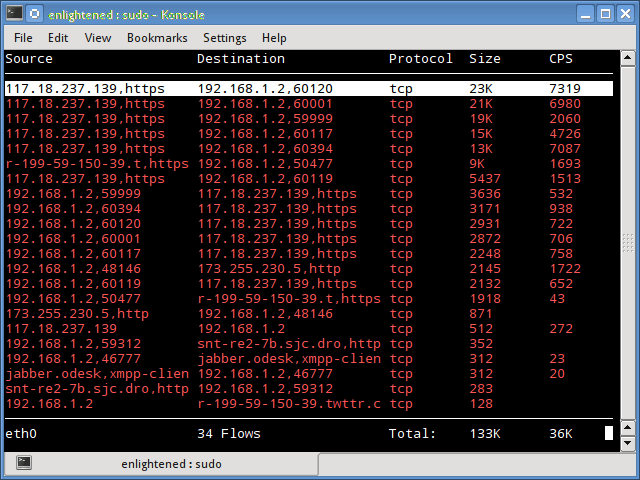
Like tcpdump and tshark, the trafshow utility accepts a set of BPF rules as command-line parameters. However, the utility’s task is not to decompose traffic into individual packets, but rather to group (summarize traffic) into flows and display the current intensity of each flow in the form of a list. For each flow, the trafshow utility displays the host and port of the source and destination of the packets, as well as the current intensity in CPS (Characters per Second, i.e. “bytes per second”) units and the amount of accumulated traffic (in bytes) during the observation time. The trafshow utility is well suited for monitoring the current network load, identifying unwanted traffic sources, and is also useful in combating DDoS attacks.
The trafshow utility always works in text-based interactive mode. This means that the user can navigate through the list of streams in real time (by moving the cursor up or down), select the stream of interest, and by pressing Enter can receive packet dumps in HEX and ASCII format for this stream. Exit from the selected stream is done by pressing the Esc key. Fig. 10 shows the terminal window in which the trafshow utility is running.
To demonstrate trafshow, the utility is run on a sniffer with a predefined set of rules that exclude unwanted and non-essential traffic. In this case, the unwanted streams include SSH and GRE (PPTP tunnel), through which the device is connected.
If these protocols are not filtered, they will create a “self-reinforcing” effect: the data that trafshow displays will simultaneously pass through the same interface, provoking positive feedback and potentially overloading the network interface.
Therefore, we enter the following command, specifying the filter:
sniffer@sniffer:~ % trafshow -i bridge0 not port 22 and not arp and not proto gre
In a separate terminal window, the ping utility is launched to the IP address of the intercom. It is launched in flood mode, which allows you to create the most intense stream of ICMP traffic for further observation in trafshow. To do this, I will enter the following command on my work PC:
rz@butterfly:~ % sudo ping -f 192.168.168.139
Password:
PING 192.168.168.139 (192.168.168.139): 56 data bytes
.....
In the process of “Flood Ping”, the ping utility continuously transmits ICMP Echo-Request packets of 56 bytes in size (by default) to the network without waiting for a response. If within a certain time a response to the transmitted packet does not arrive, such a packet is considered lost and the ping utility displays a “dot” symbol (“.”) in the terminal, which allows you to assess the intensity of losses in real time.
Let’s go to the terminal window of the sniffer connected to the machine and observe the process displayed in the trafshow utility. We will see a window, the approximate content of which is shown in Fig. 11.
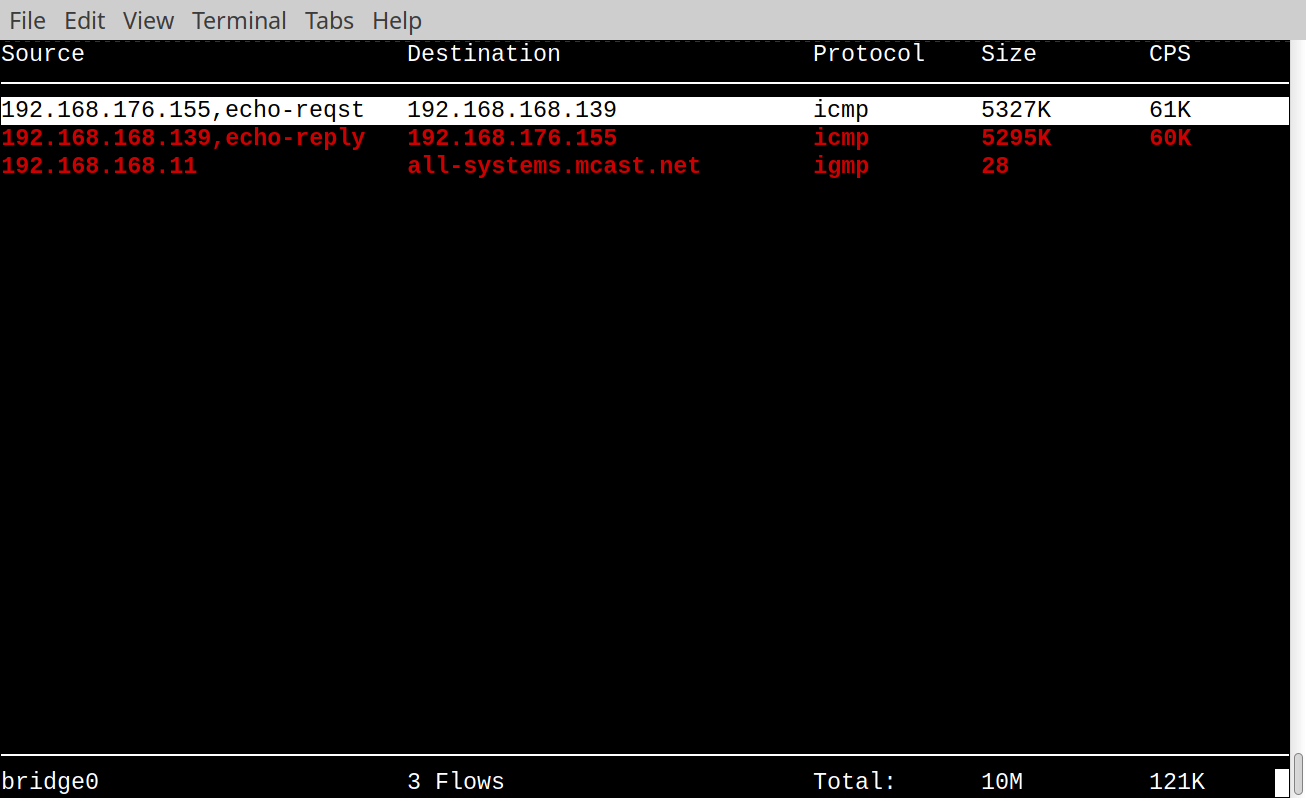
We see that trafshow has captured three streams: ICMP echo-request, ICMP echo-reply, and IGMP. The IGMP stream is a single packet from the switch and only 28 bytes are transmitted. ICMP streams, on the other hand, have a fairly high intensity of 60 KB/s (kilobytes per second) in each direction. In the bottom line, trafshow shows the total load on the network interface and the total number of bytes transmitted.
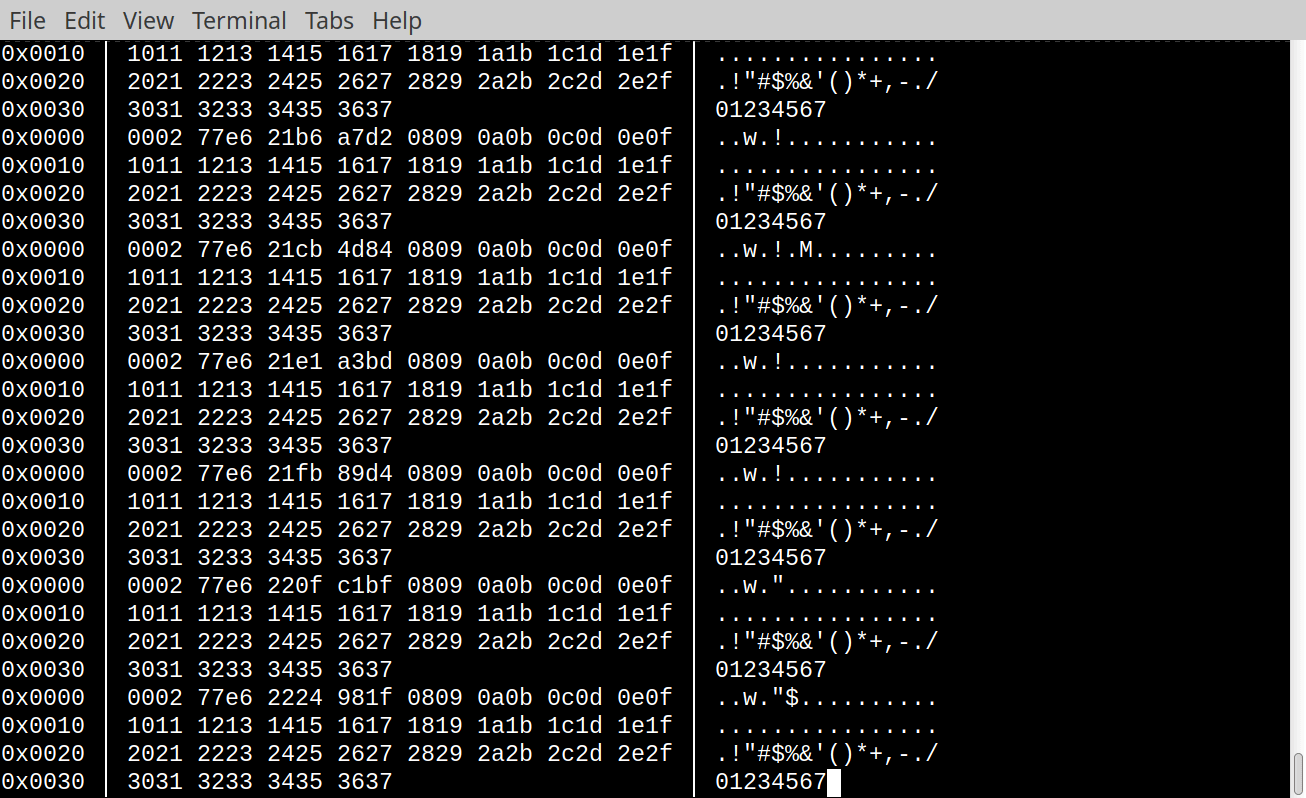
If you now press Enter and enter the first stream, trafshow will start displaying a continuous stream of captured packets. This is shown in Fig. 12 below.
Let’s stop Flood Ping and run it again, specifying a much larger payload size, for example 1400 bytes:
rz@butterfly:~ % sudo ping -s 1400 -f 192.168.168.139
PING 192.168.168.139 (192.168.168.139): 1400 data bytes
......................
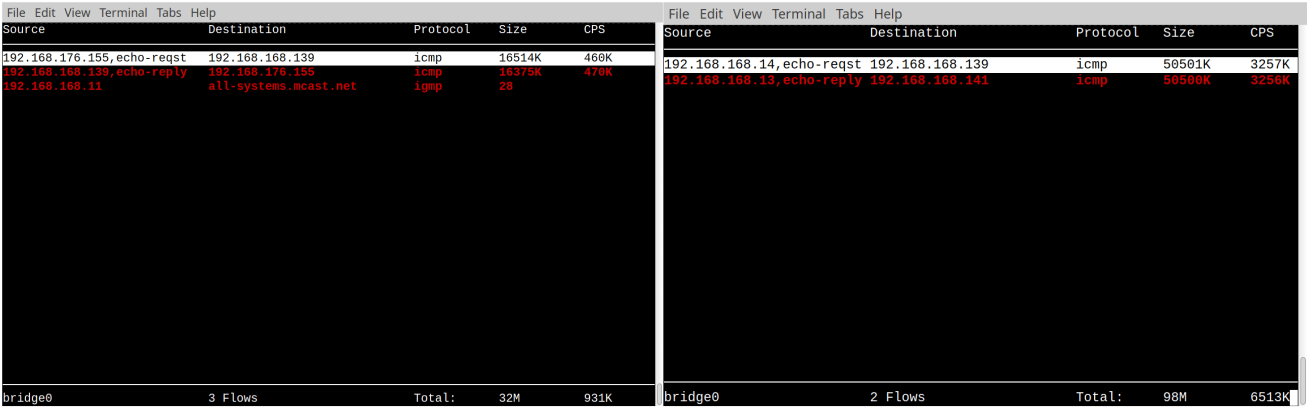
The first thing that catches your eye is that the intensity of losses has increased significantly, this is due to the larger number of “dots” and their appearance. Let’s go to the terminal window of the sniffer machine and see what the trafshow utility shows us. Fig. 13a shows that the speed (CPS) has increased significantly and is now about 460 KB/sec or 3.6 Mbit/sec, which for a FastEthernet network (this is exactly the type of Ethernet port on an IP intercom) is less than 5% of its bandwidth! We can assume that there are problems either in the network or on the device.
During repeated testing in Flood Ping mode, this time performed directly from the sniffer machine (the IP intercom is connected to it directly via a UTP patch cord), significantly different results were obtained. On the sample shown in Fig. 123, the CPS indicator reached 3257 KB/s, which is approximately 32% of the maximum possible bandwidth, and the losses amounted to only two packets (less than 0.01%).
Further analysis showed that the low bandwidth and increased packet loss in the two previous tests were caused precisely by the use of the Wi-Fi network through which the work laptop was connected. The situation clearly confirmed the well-known truth: even in seemingly obvious scenarios, unexpected technical nuances sometimes arise.
My story about network traffic analysis would be incomplete without mentioning such a wonderful utility, or even more correctly, a system, as the SNORT Intrusion Prevention System. This complex consists of the snort utility and a large number of scripts and plugins written in different languages, by different people from different companies.
The development of SNORT as a simple utility for detecting suspicious traffic began in 1998 by a small team of engineers at Sourcefire under the leadership of Martin Roesch. Already in 2009, SNORT was included in the Open Source Software Hall of Fame created by InfoWorld magazine.
In 2013, the SNORT project, together with the development team, was acquired by Cisco Systems, which continues to actively develop this open and free product. Today, SNORT is considered one of the leading solutions in the field of attack detection, intrusion prevention and active network protection.
Many commercial firewalls include SNORT as a core component of their security system, building expensive hardware solutions around it. At the same time, the utility itself remains free and available to anyone who works with network tools and knows how to configure monitoring systems.
And yes, SNORT is included in the FreeBSD package repository, so it is easy to install with the command:
sniffer@sniffer:~ % sudo pkg install snort3
To get practical benefits from SNORT, it is quite simple to install. You need deep integration with the operating system (in particular, with the PF filter built into the kernel), writing your own rules and scripts. You also need to conduct a deep restructuring of the network, without which SNORT is simply useless. But all this is within the power of an average engineer, the main thing is to be able to read the SNORT documentation and not be afraid to experiment.
This material will not consider instructions or detailed advice on setting up SNORT – the topic is too voluminous and requires a separate extensive review. The main goal here is to demonstrate the capabilities of the tool and draw the reader’s attention to its practical application.
At the same time, several examples of using SNORT based on our sniffer will still be given, but before that, it is worth briefly dwelling on the theoretical foundations. The snort utility (this is the name of the main component of the complex) can operate in one of three modes:
“Sniffer” – analyzes the traffic passing by, in an attempt to find something in it that matches the specified rules, very similar to (tshark with the -Y and -R options).
“Packet logger” – saves the packets passing by in dump files for further analysis. Moreover, there is a whole system for creating and maintaining these files, since the amount of recorded traffic can be huge, and snort copes with this wonderfully.
“Intrusion detector” (NIDS) – deeply analyzes the passing traffic and tries to determine, based on a huge database of constantly updated rules, attempts at intrusion, port scanning, spoofing or DDoS attacks. In case of detection (triggering), snort can include a “packet logger”, as well as automatically generate and add rules to PF to cut off suspicious traffic.
One of the most common predictors of an attack on a network infrastructure is scanning TCP and UDP ports on the victim’s network (or machine). The attacker scans to find potential vulnerabilities on the victim’s “body” and then attacks them. Therefore, detecting the port scanning process and responding promptly to the detection of such an event is a top priority for a well-designed defense. It should be noted that the port scanning process can be very sophisticated and generally not very susceptible to detection. However, we will consider a simple and quite frequently used example – scanning by sending empty TCP packets with the SYN flag set (connection request). The attacker generates a stream of such packets, while randomly selecting the port number. The host on which there is a service listening on the port responds to the request in an attempt to perform a handshake, because for it this is part of the standard procedure that is recorded by the attacker. Not every TCP-SYN packet with a zero payload size is a sign of scanning, but according to the established tradition, when establishing a TCP connection, the client usually sends a piece of data for the future request in the first packet. Therefore, the appearance of empty TCP-SYNs is a rather rare event. The appearance of such packets on the network in large numbers can already be considered an alarm signal.
Using the snort utility, it is very easy to detect such packets, this can be done without even resorting to fine-tuning the entire SNORT system, but simply by specifying the utility rule directly on the command line. Enter the following command:
sniffer@sniffer:~ % snort -i bridge0 -A fast --rule 'alert tcp any any -> any any (flags:S; dsize:0; msg:"Possible NMAP TCP port scan"; sid: 1231213;)'
Open another terminal window on your work PC and perform a TCP port scan on the IP address of our IP intercom using the nmap utility:
rz@butterfly:~ % sudo nmap -v 192.168.168.139
Starting Nmap 7.94 ( https://nmap.org ) at 2025-07-12 18:12 +05
Initiating Ping Scan at 18:12
Scanning 192.168.168.139 [4 ports]
...
PORT   STATE SERVICE
22/tcp open  ssh
80/tcp open  http
It can be seen that the nmap utility has detected two open ports: 22/tcp for SSH and 80/tcp for HTTP (Web-admin). Let’s switch to the sniffer machine window and observe a message of the following form:
07/15-02:55:58.000929 [**] [1:1231213:0] "Possible NMAP TCP port scan" [**] [Priority: 0] {TCP} 192.168.176.155:62246 -> 192.168.168.139:4126
07/15-02:55:58.001269 [**] [1:1231213:0] "Possible NMAP TCP port scan" [**] [Priority: 0] {TCP} 192.168.176.155:62246 -> 192.168.168.139:24800
07/15-02:55:58.001488 [**] [1:1231213:0] "Possible NMAP TCP port scan" [**] [Priority: 0] {TCP} 192.168.176.155:62246 -> 192.168.168.139:7106
07/15-02:55:58.001674 [**] [1:1231213:0] "Possible NMAP TCP port scan" [**] [Priority: 0] {TCP} 192.168.176.155:62246 -> 192.168.168.139:2998
07/15-02:55:58.001842 [**] [1:1231213:0] "Possible NMAP TCP port scan" [**] [Priority: 0] {TCP} 192.168.176.155:62246 -> 192.168.168.139:60020
Not bad! But such a one-line rule cannot cope with more sophisticated types of scanning, for example, with a decoy. Therefore, as another example, let’s consider the use of the built-in SNORT 3 plugin with the same name “port_scan”.
As mentioned earlier, SNORT 3 comes with a large number of plugins, including the port_scan module. This plugin does not cover all possible scanning scenarios, but is able to detect a significant part of their varieties.
To check the operation of port_scan, you need to make changes to the snort utility configuration file, since this plugin is disabled by default, which is provided for a number of technical reasons. Let’s start its editor like this:
sniffer@sniffer:~ % sudo ee /usr/local/etc/snort/snort.lua
Find the line in the file that contains the port_scan = variable setting, uncomment it, and assign a value:
port_scan = default_hi_port_scan
Next, look for the line ips = , uncomment it, and set it to the following value:
ips =
{
    -- use this to enable decoder and inspector alerts
    enable_builtin_rules = true,
}
Save the changes and exit ee. Run the snort utility with the following parameters:
sniffer@sniffer:~ % snort -c /usr/local/etc/snort/snort.lua -i bridge0 -A fast
After starting, the snort utility reads and parses all its configuration files (there can be a lot of them, by the way), and loads the rules described there. At the end, it outputs some statistics on the loaded rules:
--------------------------------------------------
pcre counts
               pcre_rules: 1080
              pcre_native: 1080
--------------------------------------------------
ips policies rule stats
              id  loaded  shared enabled    file
               0    4862       1    4862    /usr/local/etc/snort/snort.lua
--------------------------------------------------
rule counts
       total rules loaded: 4862
          duplicate rules: 1
               text rules: 4236
            builtin rules: 626
            option chains: 4862
            chain headers: 948
                 flowbits: 48
     flowbits not checked: 23
--------------------------------------------------
After checking and loading the configs, the snort utility goes into working mode. In the meantime, open a new terminal window on your work PC and use the nmap utility to try to perform several types of scans of the same IP address:
# TCP-SYNC
rz@butterfly:~ % sudo nmap -v 192.168.168.139

# UDP scan
rz@butterfly:~ % sudo nmap -v -sU 192.168.168.139

# IP scan
rz@butterfly:~ % sudo nmap -v -sO 192.168.168.139
Each time nmap is run, messages appear in the sniffer terminal that correspond to the specific type of scan being performed. This allows you to visually observe how different nmap modes are reflected in network traffic:
07/12-21:06:02.701981 [**] [122:1:1] "(port_scan) TCP portscan" [**] [Priority: 3] {TCP} 192.168.168.139:5950 -> 192.168.176.155:61333
07/12-21:06:02.702141 [**] [122:1:1] "(port_scan) TCP portscan" [**] [Priority: 3] {TCP} 192.168.176.155:61333 -> 192.168.168.139:617
07/12-21:06:02.702208 [**] [122:1:1] "(port_scan) TCP portscan" [**] [Priority: 3] {TCP} 192.168.168.139:617 -> 192.168.176.155:61333
07/12-21:06:02.702372 [**] [122:1:1] "(port_scan) TCP portscan" [**] [Priority: 3] {TCP} 192.168.176.155:61333 -> 192.168.168.139:9009
07/12-21:06:02.702434 [**] [122:1:1] "(port_scan) TCP portscan" [**] [Priority: 3] {TCP} 192.168.168.139:9009 -> 192.168.176.155:61333
07/12-21:06:02.703011 [**] [122:1:1] "(port_scan) TCP portscan" [**] [Priority: 3] {TCP}


07/12-21:04:38.489675 [**] [122:17:1] "(port_scan) UDP portscan" [**] [Priority: 3] {UDP} 192.168.176.155:47076 -> 192.168.168.139:34578
07/12-21:04:38.489820 [**] [122:17:1] "(port_scan) UDP portscan" [**] [Priority: 3] {UDP} 192.168.176.155:47076 -> 192.168.168.139:17207
07/12-21:04:38.490334 [**] [122:17:1] "(port_scan) UDP portscan" [**] [Priority: 3] {ICMP} 192.168.168.139 -> 192.168.176.155
07/12-21:04:38.496755 [**] [122:17:1] "(port_scan) UDP portscan" [**] [Priority: 3] {UDP} 192.168.176.155:47076 -> 192.168.168.139:18821
07/12-21:04:39.660300 [**] [122:17:1] "(port_scan) UDP portscan" [**] [Priority: 3] {UDP} 192.168.176.155:47078 -> 192.168.168.139:18821
07/12-21:04:39.660512 [**] [122:17:1] "(port_scan) UDP portscan" [**] [Priority: 3] {UDP} 192.168.176.155:47078 -> 192.168.168.139:17207


07/12-21:03:56.396242 [**] [122:9:1] "(port_scan) IP protocol scan" [**] [Priority: 3] {ICMP} 192.168.168.139 -> 192.168.176.155
07/12-21:03:56.737086 [**] [122:9:1] "(port_scan) IP protocol scan" [**] [Priority: 3] {IP} 192.168.176.155 -> 192.168.168.139
07/12-21:03:57.064270 [**] [122:9:1] "(port_scan) IP protocol scan" [**] [Priority: 3] {IP} 192.168.176.155 -> 192.168.168.139
07/12-21:03:57.385228 [**] [122:9:1] "(port_scan) IP protocol scan" [**] [Priority: 3] {IP} 192.168.176.155 -> 192.168.168.139
As already mentioned, the snort utility can be configured to send warning messages (alert) via the syslog protocol to a centralized monitoring server or to record such events in a database. It is also possible to automatically block traffic from IP addresses that generate suspicious activity.
However, detailed configuration of these features is beyond the scope of this material and can be worked out independently by the reader.
This section provides quick instructions for deploying network monitoring (sniffer). A bootable image of the FreeBSD 14.3 operating system and a set of scripts to automatically perform all the settings described in the article have been prepared. Additionally, a short cheat-sheet and several accompanying instructions in Markdown format have been created. All materials are combined into one repository and published on GitHub for ease of use.
Therefore, we execute the command: git clone https://github.com/pointcheck/sniffer.git and read README.md.
Direct link to the boot image: https://github.com/pointcheck/sniffer/raw/refs/heads/master/Sniffer-FreeBSD-14.3-bootable.img.xz
The compressed image takes up about 1GB of disk space.
7.1. Quick Installation Guide for a FreeBSD-Based Sniffer
1. Insert a free USB Flash drive into the USB port of your desktop PC. You will need a drive no larger than 5GB.
2. Unzip the downloaded image and write it to a USB drive using the following command:
For FreeBSD:
sudo sh -c "xz -d -c Sniffer-FreeBSD-14.3-bootable.img.xz | dd of=/dev/da0 bs=1m conv=sync status=progress"
For Linux:
sudo sh -c "xz -d -c Sniffer-FreeBSD-14.3-bootable.img.xz | dd of=/dev/sdb bs=1m conv=sync status=progress"
The only difference is the naming of the USB drive. Windows users will have to bother with Rufus or a similar utility.
3. After the recording is complete, move the USB drive from your PC to the mini-PC from which you are going to make a sniffer, and boot the mini-PC from this USB media. Any x86 compatible machine with two Ethernet ports can act as a sniffer, one of the ports can be an external USB-Ethernet. Do not forget to go into the BIOS and set the priority of booting from the USB media.
4. After booting the FreeBSD OS, log in as the user sniffer using the password reffins. Just in case, the root password is: 1234. Change it to a more correct one, in your opinion, using the passwd command.
5. Run the WiFi configuration script to have remote access to the sniffer machine:
sudo ./sniffer_setup_wifi.pl
The script will scan the airwaves and show available SSIDs of WiFi points, then ask to enter the name of one of them, then ask to enter the PSK password. The script will save this data to /etc/wpa_supplicant.conf and restart the network.
6. Connect both Ethernet ports of the mini-PC to the cut between the device under test (DUT) and the network using two UTP patch cords. Run the script to configure Ethernet Bridging:
sudo ./sniffer_setup_bridge.pl
The script will display the network interfaces available on your system and ask you to enter the names of the network interfaces (one at a time) that you want to bridge. As a result, it will create a new network interface bridge0, add the appropriate lines to the configuration file /etc/rc.conf, and restart the network stack and services. At this point, when connecting via WiFi, you may lose connection to the machine.
7. Run the script (optional) to configure mpd5 to organize PPTP, L2TP, and PPPOE tunnels for remote connection to the sniffer machine from the Internet:
sudo ./sniffer_setup_mpd5.pl
The script will ask you to select the tunnel type (you can select all three at once), specify the username, password and server IP address. As a result, the script will create a configuration file /usr/local/etc/mpd5/mpd.conf and place two scripts ifup.sh and ifdown.sh next to each other.
Important! This script will configure the system to use multiple routing tables (FIB), this is a standard way in the FreeBSD OS to organize “source routing”. This is necessary so that all three tunnels do not interfere with each other, because each of them will have its own “default route”. The ifup.sh script will start a copy of sshd to service connections only for the specified tunnel. If you have all three types of tunnels configured and connected, then there will be four copies of sshd in the system (one system copy, on a zero FIB).
8. Restart the sniffer machine with the command:
sudo reboot
9. Log in again (connect via ssh or from the console). You have the following utilities at your disposal: tcpdump, tshark, trafshow, and snort.
10. A short “cheat-sheet” is located in the file cheasheet.md. You can view the contents of the file with the command:
more cheatsheet.md
11. I recommend setting the cheat sheet as a Message of the Day so that it is displayed every time you log in. You can do this with the following command sequence: 12. Several instructions with typical operations are located in .md files in the sniffer user directory, you can read them with the following commands:
sudo cp cheatsheet.md /etc/motd.template
sudo service motd restart
more rule_sip.md
more rule_ssh.md
more rule_http_password.md
more snort.md
After some time working with the sniffer, you will probably want to create your own (based on the current system) bootable image for a USB drive. The following two scripts will help you do this:
1. To create a bootable USB drive based on the current system, connect to the sniffer machine, and the operating system must be booted from the SSD or HDD ( /dev/ada0 ). Insert a free USB drive and run the following script:
sudo ./make_bootable_usb.sh
This script will completely erase the data on the USB, recreate a new partition table, map the file systems, add an EFI boot loader, and copy the current system.
After running this script, you will have another USB drive.
2. To make an image file ( .img.xz ) from this USB drive that you can upload to Github or share with friends, run the following script:
sudo ./make_image.sh
In this part, we have gathered together all the practical tools that turn the prepared platform into a real tool for network diagnostics. The considered principles of creating an Ethernet bridge, connection options and sniffer switching schemes allow you to adapt it to any conditions – from home networks to remote scenarios of work through a tunnel. The use of BPF filters, tcpdump, tshark and analysis of individual protocols form a flexible traffic monitoring system, and Snort integration makes it possible not only to observe, but also to detect suspicious activity.
The result is a compact, manageable and quite powerful tool that is easy to scale for your own tasks – troubleshooting, load analysis, anomaly detection or studying the behavior of network devices. This approach shows that even on the basis of affordable equipment and open technologies, you can create a professional working tool that is in no way inferior to expensive commercial solutions in its category.