
05.12.2025
62 min
490

This part describes the preparation of a reliable network tool based on FreeBSD. It covers the basic steps of installing the system, properly configuring the environment, and checking the hardware before working with traffic. The material is suitable for engineers who want to create their own diagnostic device, understand the capabilities of the hardware, and lay a solid foundation for further network analysis.
The idea of creating a compact tool for diagnosing network problems presented in the material may seem predictable to old-school engineers, but for many young professionals who are accustomed to expensive certified solutions such as Cisco Systems or Fluke Networks, it opens up the potential of FreeBSD in its “pure” form. All you need to do is install the system on a compact device with two Ethernet interfaces and perform basic configuration – and a full-fledged tool for network analysis is ready to work.
The concept of a “stand-alone” solution for remote diagnostics of Ethernet networks arose back in the days when Internet providers widely used ordinary PC equipment with FreeBSD for routing and server tasks. At that time, the operating system demonstrated stability, a rich set of network capabilities “out of the box” and undemanding to hardware resources. Even today, many infrastructures continue to operate on similar configurations without failures for years.
The need to return to this idea is due to modern challenges. One of the customers operates a large fleet of heterogeneous IP intercoms and constantly encounters compatibility problems that cannot be correctly diagnosed without access to network traffic. Many budget segment models do not provide the ability to view the internal logic of operation, specific SIP parameters or NAT traversal mechanisms, and third-party support services are not always able to quickly deal with the problem. In such conditions, it is critically important to be able to correctly intercept traffic, examine it and objectively determine at what stage the error occurs.
That is why there was a need for a simple, autonomous and universal tool that can work in different network environments and provide a sufficient amount of data for technical analysis.
One of the classic ways to intercept network traffic is to set a switch port (or a separate VLAN) to a special mode, in which all packets from the desired port are duplicated to another, free port. In Cisco terminology, this is known as SPAN. An analyzer is connected to such a port – for example, a Fluke OptiView or a computer running WireShark.
This method has significant drawbacks: the switch must support SPAN, full administrative access is required, and a separate laptop or specialized expensive device is required for analysis. Also, the engineer often has to be physically on site, which is not always convenient. There is also a risk of disrupting the network by incorrect configuration, so administrators use this method with great caution.
An alternative approach is much simpler – using a regular PC with two Ethernet interfaces, between which a transparent bridge is created (Ethernet Bridging). For network equipment, such a bridge is practically invisible: apart from the minimal delay, it is difficult to detect. The main advantage is the ability to programmatically analyze, filter, or record all traffic passing between interfaces.
The device is controlled remotely, for example, via SSH over an L2TP or PPTP tunnel that is automatically launched when the system boots. The result is a compact, autonomous, and fully remotely controllable monitoring tool. To install, simply connect two patch cords and power.
Such a “sniffer,” installed between two switches, allows you to analyze all traffic between them — to detect network storms, NAT or SIP problems, equipment interaction errors, and even potential intrusion attempts. At the same time, it is worth considering that the resources of a regular PC may not be enough for backbone channels, so this solution is optimal for networks closer to the subscriber.
This tool is an affordable alternative to expensive professional analyzers. Commercial devices of a similar class can cost from 50,000 to 100,000 UAH, while on the secondary market similar solutions can be found for 4000–5000 UAH, which is much more profitable.
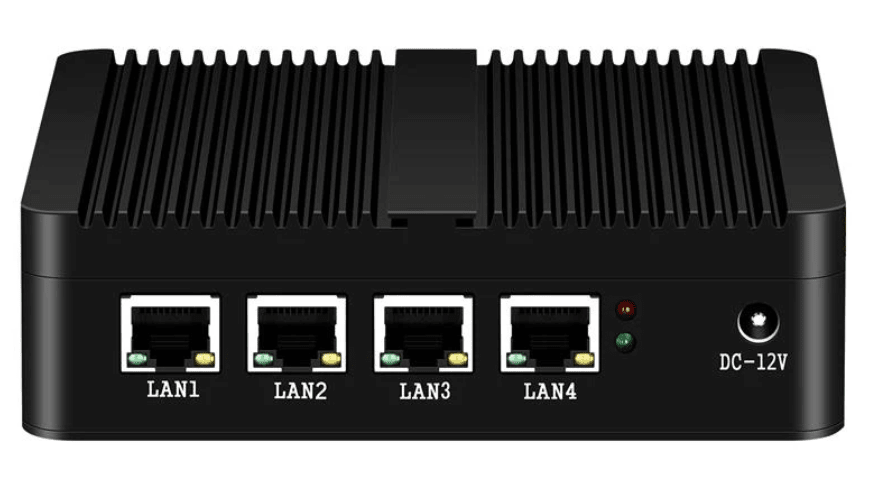
To implement the concept, you need an x86-compatible PC with two Gigabit Ethernet ports. For a long time, compact devices of this type were a rarity, and USB network adapters turned out to be unreliable for long-term monitoring. Problems can appear irregularly, and a long wait with a laptop in a technical room is an impractical solution. Especially when monitoring can be carried out in an apartment or a private house.
The situation has changed with the advent of compact computers based on Intel Atom. One of these is a single-board PC in the nano-ITX format on the Intel Atom J1190 (2.4 GHz), equipped with 8 GB DDR4, a 128 GB SSD and four 2.5G Ethernet ports, which is offered for approximately 4380 UAH. For its price, it provides functionality sufficient for the role of a network sniffer, and is much more affordable than expensive professional analyzers.
The appearance of this mini-PC immediately reminded of the concept of an autonomous sniffer, and during a discussion with the customer servicing the IP intercom network, the idea was raised again. At first, it was not understood and could not be properly evaluated, but over time, the number of unresolved network problems grew, and user complaints accumulated.
When the situation worsened, the proposal was considered again – and it was then that a competent specialist appeared in the customer’s company, who quickly saw the practical benefits of such an approach. The project was developed.
It was not possible to purchase a mini-PC from XCY due to restrictions on purchases on Chinese marketplaces, but the new specialist quickly selected a local analogue – the Horizon N5 mini-PC from the Singaporean design center, which is supplied to the market under the Rambica brand.
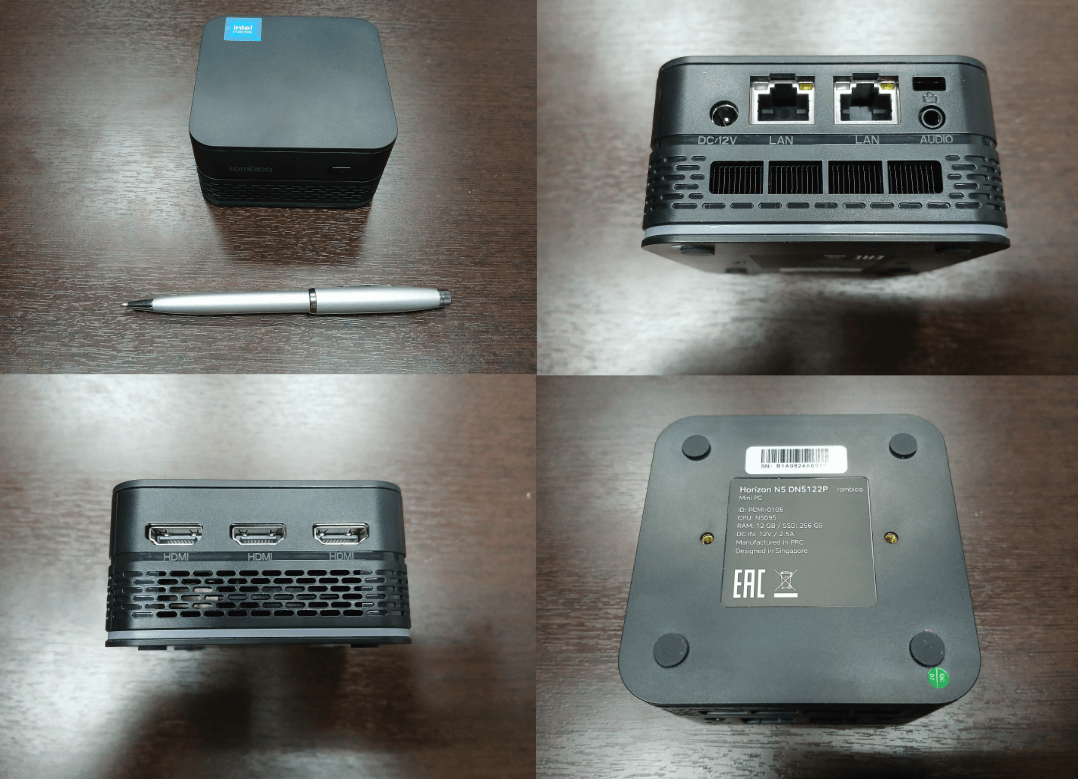
Rambica Horizon N5 DN5122P [PCMI-0105] is equipped with a different processor — Intel Celeron N5105 with four cores at 2 GHz. The device has 12 GB of DDR4 RAM and a 256 GB SSD. Unlike the XCY model, the Horizon N5 is equipped with two 1-Gbit Ethernet ports, which is more than enough to build a sniffer in small-scale networks. Additionally, it is equipped with built-in Wi-Fi, three HDMI ports, three USB 3.0 and decorative RGB lighting.
Compact dimensions of 47×88×88 mm and a cost of about 9,300 UAH make this device a competitive solution compared to popular single-board computers like the Raspberry Pi 5, especially considering the performance and set of interfaces.
After purchasing the Horizon N5, the device was transferred for installation and configuration of FreeBSD in accordance with the requirements. The material further describes the process of preparation, configuration and practical use of this hardware solution as the basis for an autonomous network sniffer.
So, we can move on to the technical part of the implementation of the idea.
To install the FreeBSD operating system, configure and test the sniffer, we will need the following additional tools::
A working PC with Windows/Linux/FreeBSD or any other modern OS with 3 GB of free disk space. This PC must have a tool that allows you to connect to other machines via SSH (ssh, putty.exe).
A USB Flash drive with a capacity of at least 2 GB.
A monitor/TV with an HDMI interface.
A USB 2.0 keyboard
Two prepared UTP patch cords.
Access to a WiFi network (access password) with Internet access.
First of all, we will need to download a bootable image of the system with the installer on board. The FreeBSD project website presents several different versions of this operating system. At the time of writing this article, there are three different branches of the FreeBSD OS: the current development 15.0-CURRENT, the outdated but still supported 13.5-RELEASE, and the stable 14.3-RELEASE. We will download the stable version 14.3-RELEASE. For each version of the OS, several image options of different sizes and purposes are offered. Including:
dvd1 – contains a bootable system designed for installation from DVD or USB, as well as a set of pre-assembled binaries for the graphical interface. This option is the most voluminous and is intended for installation as a workstation on the user’s PC.
disc1 – the same, only without assembled packages. There is also an option for a workstation.
bootonly – does not contain an installer, but can be loaded from CD-ROM or USB as a temporary working OS.
memstick – optimized for deployment on USB media, containing the minimum sufficient to perform the installation.
mini-memctick – the same as memstick, but without an installer. More suitable as a disaster recovery.
The site also presents ready-made images for virtual machines rented from Amazon AWS EC2. We are not interested in all this now.
And we are interested in a minimal image with an installer, that is, a memstick. We go to the images page and see that the FreeBSD OS is available for several different platforms, including amd64, arm64 (in several variants), i386, PowerPC, PowerPC64 (also in several variants), and RISCV64. For each of the supported platforms, the image is presented in the usual (.img) and packed (.img.xz) format.
In this case, we are interested in the amd64 platform, which means we download the file FreeBSD-14.3-RELEASE-amd64-memstick.img.xz, which takes up about 800 MB.
While the boot image is downloading, we need to connect a USB keyboard, an HDMI monitor to our Mini-PC, apply power, press the Power button and enter the BIOS to change a number of settings. I would like to note right away that for some unknown reason, wired USB 1.0 keyboards do not work with the BIOS of this mini-PC, but everything worked out with the wireless Logitech USB 2.0.
As always, you need to act quickly – immediately after turning on the power (which is indicated by the cheerful illumination of the RGB backlight), you need to press the DEL key repeatedly before the image appears on the monitor screen. If you miss a moment, the device will load the previously installed OS on the SSD of unknown origin with a very strange and incomprehensible user interface. 😉
If you were quick enough, then the text menu of the usual AMI BIOS will open in front of you.
In the BIOS menu, you need to change the following settings:
Set the boot order: USB first: Boot → Hard Disk Drives: USB.
Set the mode the device enters after a power failure (loss and recovery). It is necessary to set the S0 mode so that the device always turns on and boots immediately after power is applied, without waiting for the Power key to be pressed: Boot → State After G3: S0 State.
After changing the settings, you must exit the BIOS menu and save the changes, that is, select Save Settings and Exit.
After downloading the image, you need to unzip it with the xz command. You will need about 2 GB of free disk space to write the image.
# xz -d FreeBSD-14.3-RELEASE-amd64-memstick.img.xz
The FreeBSD download page lists the following dd command with parameters for writing the image to a USB drive:
# dd if=FreeBSD-14.3-RELEASE-amd64-memstick.img of=/dev/da0 bs=1m conv=sync status=progress
You can burn the image without unpacking it, so as not to waste disk space, using the following command:
# zx -d -c FreeBSD-14.3-RELEASE-amd64-memstick.img.xz | dd of=/dev/da0 bs=1m conv=sync status=progress
These commands must be executed as root (or use the sudo utility). The commands work equally well in both Linux and FreeBSD. The only thing you need to do when working in Linux is to change the name of the USB device file to /dev/sdb (or whatever you have defined, see dmesg).
However, the dd command is not available in Windows. In the latter, you will have to download and install the Rufus or USBImager utility in advance and follow the appropriate instructions. By the way, you can unpack the image under Windows using the winrar.exe utility, which supports the xz format.
Insert the USB drive into any of the USB connectors, turn off and turn on the device. If the previous operations were successful (the BIOS is configured to boot from USB and the image was successfully written to the USB Flash drive), then within a few seconds you will be presented with the FreeBSD boot loader, which will offer several options:
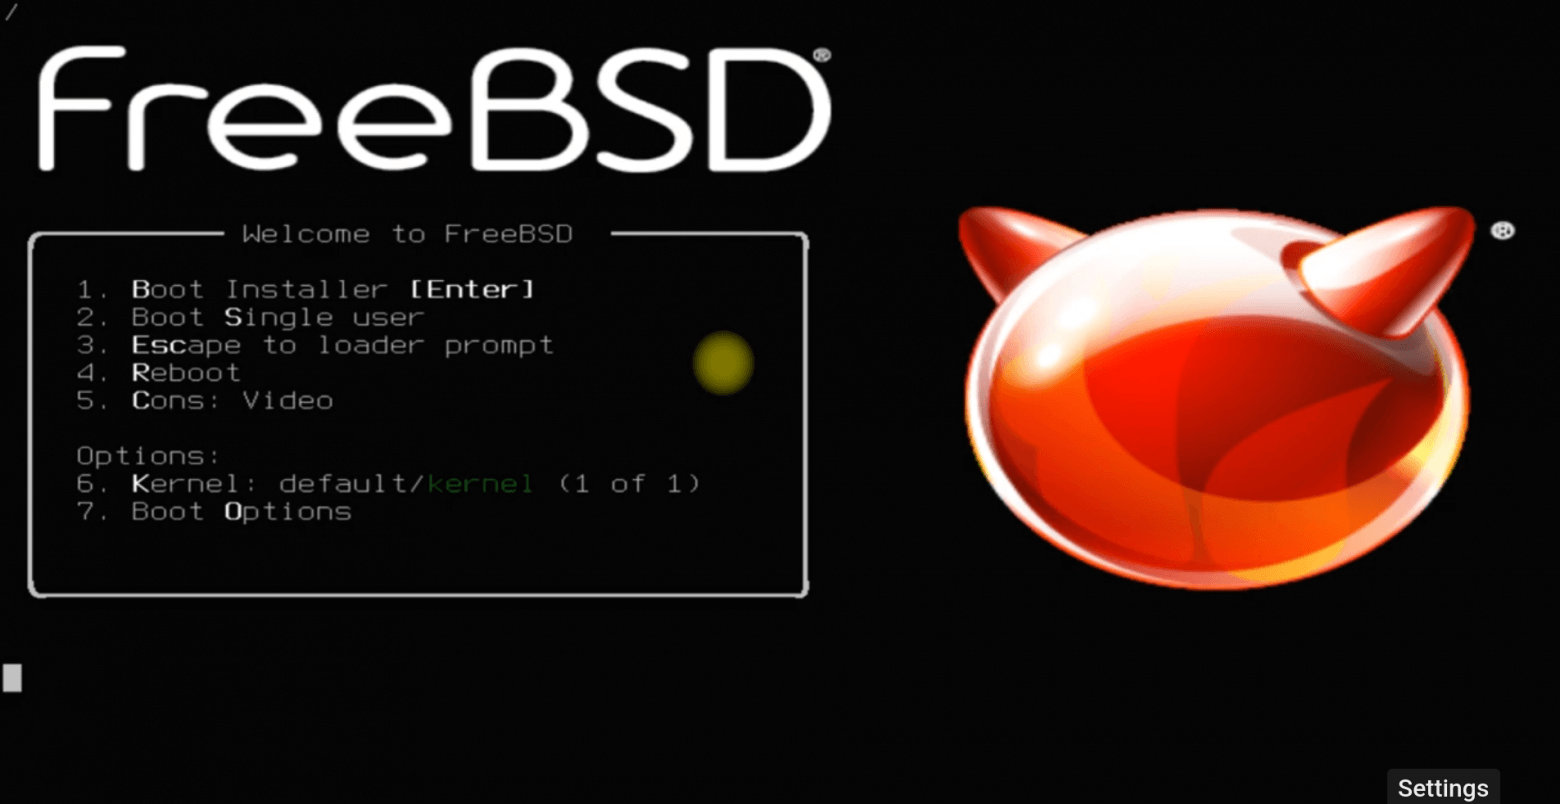
At this point, you can simply do nothing, but wait 10 seconds and the active (first) Boot Installer menu will be selected automatically. Or press Enter to speed up the selection. The system will continue booting, lines of text from the OS kernel will run across the screen, informing about the detected devices, loaded drivers and their parameters. Eventually, you will be presented with an invitation from the FreeBSD Installer on a blue background:
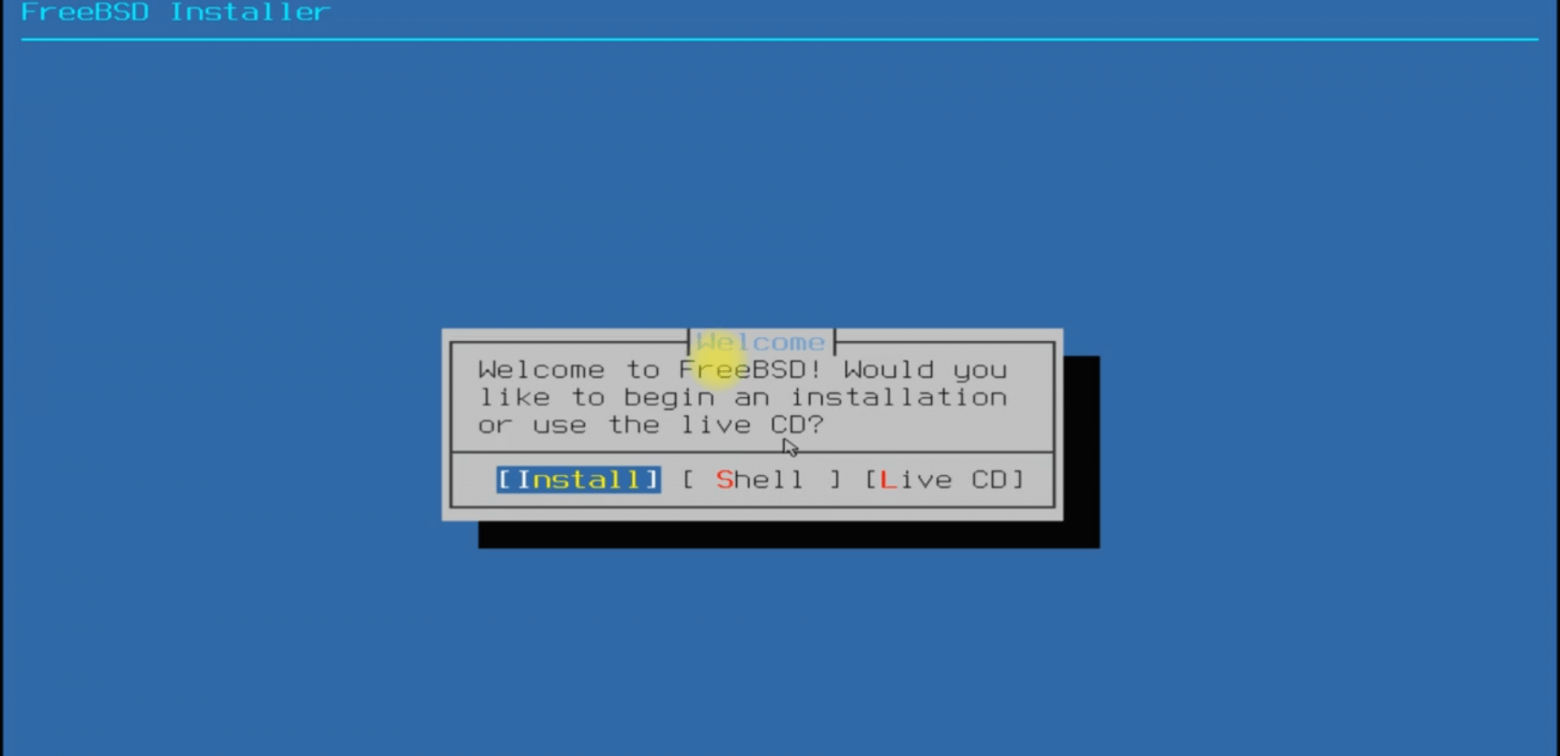
The installer offers three different options, select [Install]. All detailed steps of installing FreeBSD and screenshots of the installation are described in many articles and videos available in the public domain. Therefore, this material provides only the sequence of basic actions and some important points that should be considered during setup:
1. First, the installer will offer to choose a keyboard layout. In FreeBSD terms, this is called “Keymap”.
2. Next, the installer will ask you to specify the name of the machine. In Unix, it is customary to give machines (hosts) romantic names. In our case, I suggest calling the host a word that reflects its future vile and vile work: sniffer.
3. In the next step, the installer will ask you to select a set of distributions (a set of standard packages). Disable everything related to debugging (*-dbg), enable lib32 and move on.
4. Next, the installer will offer to partition the disk. Select Auto (UFS) and continue. In no case do not select ZFS – this is not what we need for our task!
5. The installer will display a list of available disks, among which will be /dev/ada0 – this is our SSD drive, and will offer the option of partitioning into separate file systems. We do not change anything, agree and move on.
6. The installer will offer to select the type of partition table (BSD, GPT, MBR and others). We select GPT. This is a popular and convenient method that allows you to access disk volumes by unique identifiers. This abbreviation has nothing to do with neural networks!
7. After that, the installer will start the installation: it will partition the disk, create a partition table and unpack the necessary system packages with the kernel, utilities and libraries. The whole process takes from 30 to 60 seconds.
Here it is necessary to note. If there is another operating system previously installed on the SSD, the installer will ask to confirm the fact that this OS will be destroyed during the installation process. We agree without looking and click and click <Commit> .
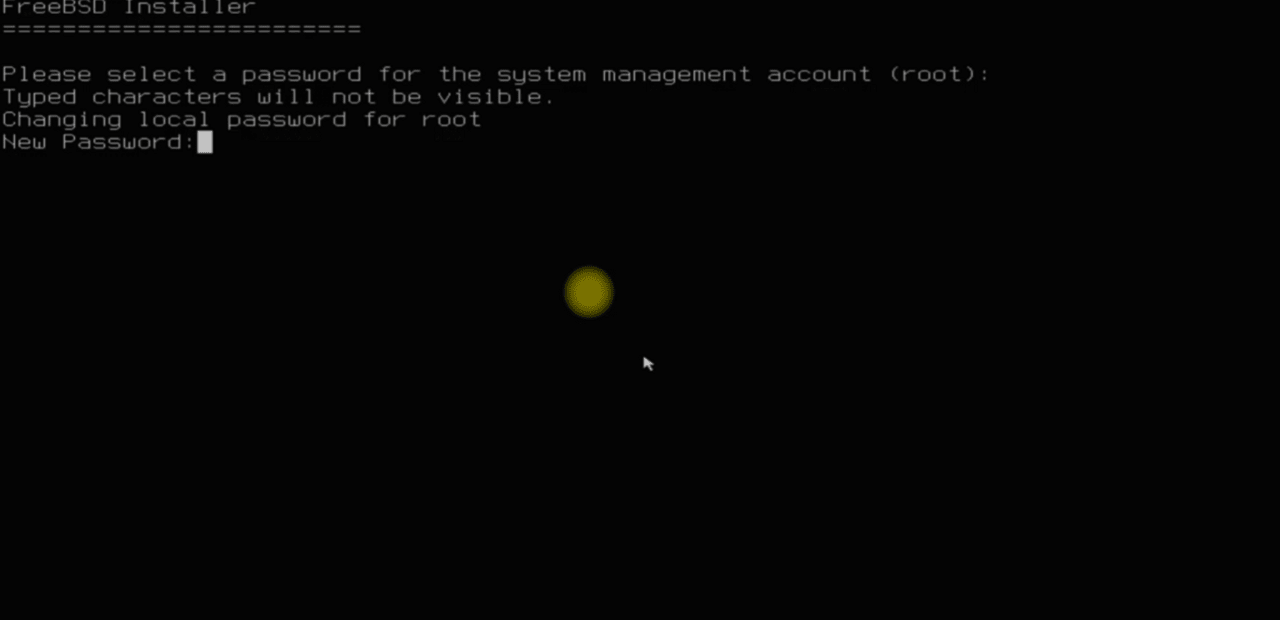
8. After completion, the installer will show a black terminal window and ask to set a password for the root user. We enter 1234 several times, some serious and super-complicated password is not needed here. We are preparing a tool for work, not a super-secure firewall.
9. The installer will return to the blue screen and ask you to configure network interfaces. You do not need to configure Ethernet interfaces, we will perform this procedure later when configuring Ethernet Bridging. But what you need to do is configure WiFi – we need this for remote device management and installation of additional software.
You need to select the wlan0 interface and answer the additional questions of the installer: specify the name (SSID) of the wireless network, authorization type, password, indicate the use of IPv4 and enable DHCP to automatically obtain an IP address and other network settings.
10. The installer will offer to configure IPv6. You should not do this, unless, of course, you are an expert in this matter. Select No and move on.
11. Next, the installer will ask you to specify the domain name to which this machine belongs and the DNS server name. Leave everything as it is: localdomain and the IP address of the DNS server obtained via DHCP. If there is no network connection at the time of installation, you must specify the DNS server address manually.
12. The next step of the installer will ask you to select a region and country in order to correctly set the time zone. Select Asia, then Russia. Then select the appropriate time zone (in my case, it is MSK+2).
13. Next, the system will offer to set the current date and time. You can skip this item (select Skip), because later we will install the ntpd daemon, which is responsible for synchronizing the system time.
14. The next step of the installer will offer to make a number of system settings. It is necessary to note the services: sshd (remote access to the system), ntpd (time synchronization) and powerd (power management).
15. Next, the installer will offer to strengthen security by “tightening the nuts” (System Hardening). There is no need to enable or disable anything here, everything in the system is already quite safe by default. In addition, some options can add unexpected problems.
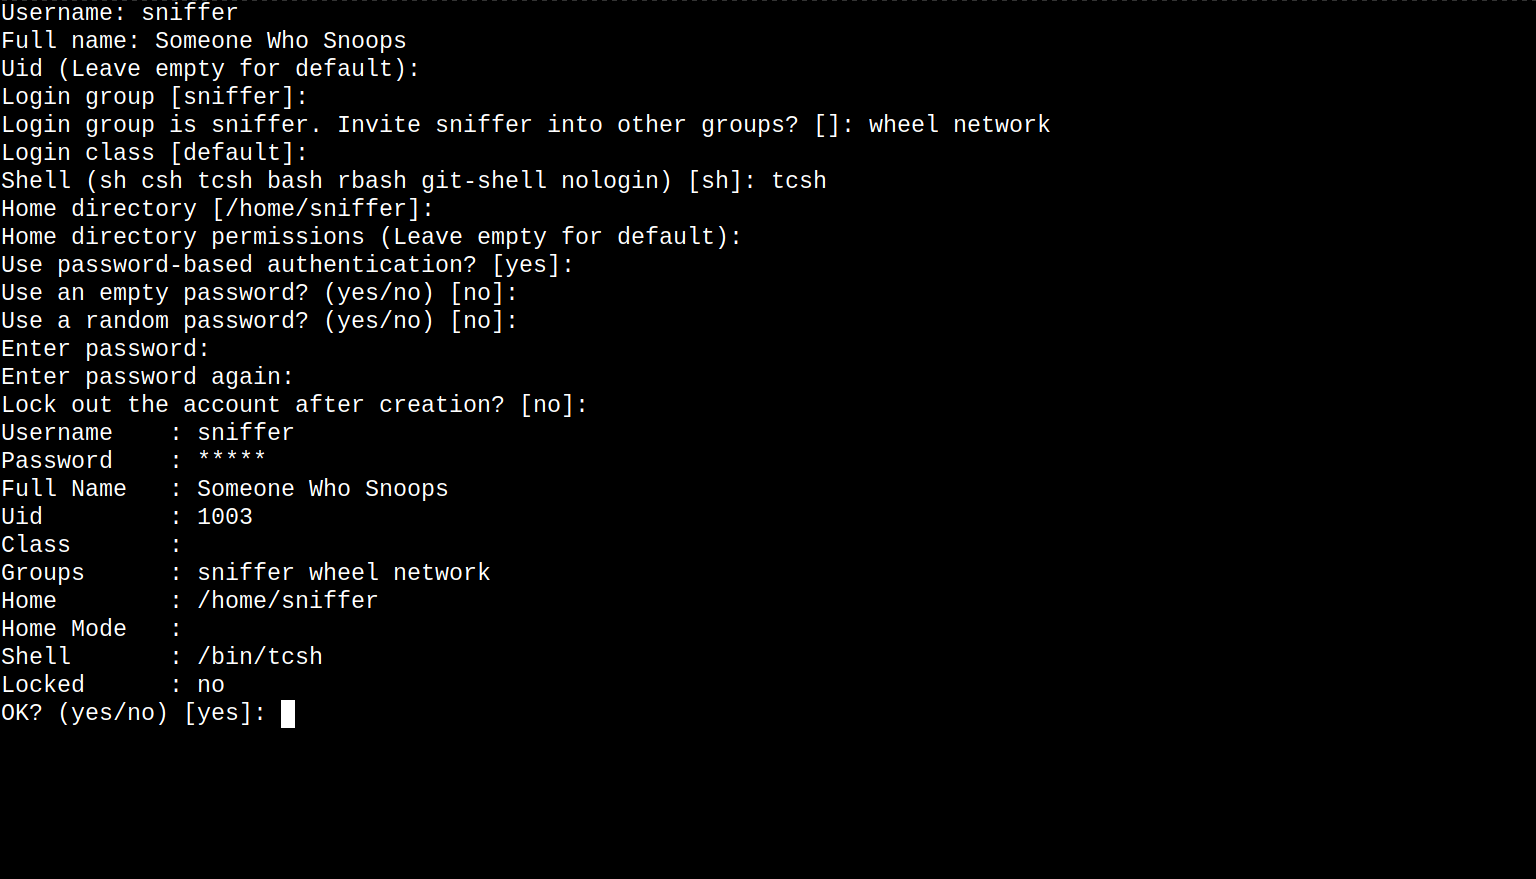
16. The next step, the installer will offer to add a new user. This is something you must do! In the black screen, specify the name of the new user, for example sniffer. Set the password, for example reffins. The user must be added to the wheel and network groups, and even set the shell type to tcsh. Screenshot in Fig. 6.
Adding a user to the wheel group will make this user an administrator, and adding it to the network group will allow you to use network utilities without increasing the privilege level (without sudo).
17. After adding a new user, the installer will return to the blue screen and offer to perform a number of more system configuration operations. At this stage, you can finish installing the system and reboot the machine. To do this, you need to remove the USB Flash media from the port and select the Exit menu.
The installer will offer to start a shell to give you another opportunity to further configure the system. Here you need to select No, after which the installer will display a menu with the Reboot option. Select it and wait for the system to reboot.
After going through the bootloader and the text of diagnostic messages from the OS kernel, which quickly flies by, the user will eventually be invited to log in:
Tue Jul  8 01:59:11 +05 2025

FreeBSD/amd64 (sniffer) (ttyv0)

login: sniffer
Password: reffins
We specify the user sniffer, the password reffins and enter the tcsh shell after first and very briefly reading the Message of the Day (motd) of the following type:
Welcome to FreeBSD!

Release Notes, Errata: https://www.FreeBSD.org/releases/
Security Advisories:   https://www.FreeBSD.org/security/
FreeBSD Handbook:      https://www.FreeBSD.org/handbook/
FreeBSD FAQ:           https://www.FreeBSD.org/faq/
Questions List:        https://www.FreeBSD.org/lists/questions/
FreeBSD Forums:        https://forums.FreeBSD.org/

Documents installed with the system are in the /usr/local/share/doc/freebsd/
directory, or can be installed later with:  pkg install en-freebsd-doc
For other languages, replace "en" with a language code like de or fr.

Show the version of FreeBSD installed:  freebsd-version ; uname -a
Please include that output and any error messages when posting questions.
Introduction to manual pages:  man man
FreeBSD directory layout:      man hier

To change this login announcement, see motd(5).

sniffer@sniffer:~ %
The last line sniffer@sniffer:~ % is the invitation from the tcsh shell. It means that you are a regular user (the % symbol indicates this) named sniffer on a machine named sniffer. At this stage, we need to continue pre-installing various useful program packages and utilities.
Before starting the installation of packages, you must first obtain administrator privileges, and secondly, find out whether the network connection via WiFi is configured and up. We will download all programs in this way. Of course, this can also be done via wired Ethernet, but in this case it will be more convenient if we leave the wired network interfaces re0 and re1 untouched for further bridge configuration. But these are all conventions, and you can act differently. 🙂
To gain administrator privileges, you must enter the command su and specify the password for the user root . Recall that earlier during installation the password for root was set as 1234 .
sniffer@sniffer:~ % su
Password: 1234

#
After entering the correct password, the command line will change. The # symbol at the end of the prompt means that administrator privileges have been activated, and therefore all further actions should be performed with extreme caution to avoid accidentally deleting important files or violating the system configuration.
The prompt with the # symbol is created by the sh shell, which is used by the root user by default. This shell is basic and not very convenient, so it is usually replaced with the more functional tcsh.
You can replace the shell with the following command:
# chsh -s tcsh
chsh: user information updated
The chsh utility has reported that the shell has been replaced. Now we will exit the old shell with the exit command and execute the su command again:
# exit

sniffer@sniffer:~ % su

Password: 1234
root@sniffer:/home/sniffer #
We have administrator rights again, but now in the prompt we see under which user (root) and on which machine (sniffer) we are working, as well as in which directory of the file system tree (/home/sniffer) we are currently located. This is not the only convenience provided by the tcsh shell, by pressing the up/down arrows, you can now navigate through the history of previously executed commands. In this case, you can specify part of the command name and press the arrows and tcsh will find a command close in line.
You can check the presence of a WiFi connection with the ifconfig command. Enter the command:
root@sniffer:/home/sniffer # ifconfig wlan0
and we get an answer of the form:
wlan0: flags=8843<UP,BROADCAST,RUNNING,SIMPLEX,MULTICAST> metric 0 mtu 1500
        options=0
        ether b0:ac:82:7c:c2:5b
        inet 192.168.168.140 netmask 0xffffff00 broadcast 192.168.168.255
        groups: wlan
        ssid SOME_NETWORK channel 149 (5745 MHz 11a) bssid 50:ff:20:78:f8:23
        regdomain FCC country US authmode WPA1+WPA2/802.11i privacy ON
        deftxkey UNDEF AES-CCM 3:128-bit txpower 23 bmiss 7 mcastrate 6
        mgmtrate 6 scanvalid 60 wme roaming MANUAL
        parent interface: rtw880
        media: IEEE 802.11 Wireless Ethernet OFDM/36Mbps mode 11a
        status: associated
        nd6 options=29<PERFORMNUD,IFDISABLED,AUTO_LINKLOCAL>
In the output of the ifconfig command, the highlighted lines are of interest:
status: associated – means that the connection to the WiFi access point is established;
ssid SOME_NETWORK – contains the name of the access point (here for example: SOME_NETWORK);
inet 192.168.168.140 – shows which IP address is issued by the network (DHCP server) for this machine.
If you get a similar result, it means that the network connection is established, you can ping any host on the global network and check if there is access to the Internet:
root@sniffer:/home/sniffer # ping www.google.com

PING www.google.com (173.194.220.147): 56 data bytes
64 bytes from 173.194.220.147: icmp_seq=0 ttl=107 time=106.200 ms
64 bytes from 173.194.220.147: icmp_seq=1 ttl=107 time=107.547 ms
64 bytes from 173.194.220.147: icmp_seq=2 ttl=107 time=106.863 ms
^C
--- www.google.com ping statistics ---
3 packets transmitted, 3 packets received, 0.0% packet loss
round-trip min/avg/max/stddev = 106.200/106.870/107.547/0.550 ms
Exiting the ping command, like any other, in Unix-like systems is done by pressing Ctrl-C. This initiates the sending of the SIGINT signal to the process, which terminates its execution and transfers control back to the tcsh shell.
If you are unable to connect to the network, you will have to delve into the WiFi settings. The wpa_supplicant daemon is responsible for WiFi in the FreeBSD operating system, its configuration file is located in /etc/wpa_supplicant.conf. Try checking whether the password and access point name are specified correctly. To do this, open this file in the ee or vi editor:
root@sniffer:/home/sniffer # ee /etc/wpa_supplicant.conf
After making corrections to the configuration file, it should be saved. In the ee editor, this is done by pressing the sequence ESC, Enter, and Enter again. The saved config will be accepted by the wpa_supplicant daemon only after the network (wlan0) interface is restarted. To do this, enter the following command:
root@sniffer:/home/sniffer # service netif restart wlan0
Stopping wpa_supplicant.
Waiting for PIDS: 46902.
Stopping Network: wlan0.
Destroyed wlan(4) interfaces: wlan0.
Created wlan(4) interfaces: wlan0.
Starting wpa_supplicant.
Starting Network: wlan0.
After a few seconds, you should check the connection again with the ifconfig wlan0 command.
Let’s assume that the system has Internet access and we can proceed to installing packages. Installing, removing and upgrading pre-compiled (pre-compiled) software packages in the FreeBSD operating system is done with the pkg command (utility). This utility has several extensions:
pkg search – searches for a package, based on a given string of characters, in a centralized repository located on the FreeBSD project website.
pkg install – installs a package by its exact name.
pkg remove – removes a previously installed package.
pkg info – displays detailed information about the installed package.
Let’s see how it works. For example, let’s search for a package with the string “WireShark”:
root@sniffer:/home/sniffer # pkg search WireShark
wireshark-4.4.7                Powerful network analyzer/capture tool
wireshark-nox11-4.4.7          Powerful network analyzer/capture tool (without GUI)
pkg search lists the packages found and their brief descriptions, one per line. In this example, we see that there are two versions of the wireshark package in the repository – one with a graphical interface and one without (nox11).
To set up a network sniffer, we need to install the following software and utility packages:
sudo – to obtain administrator privileges;
screen – to manage virtual terminals and simultaneously run several programs with remote control;
wireshark-nox11 – to capture and analyze network traffic;
trafshow – to analyze the current network load;
snort3 – to analyze and detect potential security problems and intrusions.
mpd5 – a daemon for creating a tunnel connection with an L2TP or PPTP server to organize a remote sniffer control channel.
gcc, cmake, gmake, git – a C compiler and a set of utilities for compiling other programs from source code.
cpu-x – a utility for collecting and displaying information about the hardware of a computer system.
Well, let’s install them all together. To do this, we’ll enter the following very long command:
root@sniffer:/home/sniffer # pkg install sudo screen wireshark-nox11 trafshow snort3 mpd5 gcc cmake gmake git cpu-x

Updating FreeBSD repository catalogue...
FreeBSD repository is up to date.
Updating FreeBSD-kmods repository catalogue...
FreeBSD-kmods repository is up to date.
All repositories are up to date.
The following XXX package(s) will be affected (of 0 checked):

New packages to be INSTALLED:
        e2fsprogs-libuuid: 1.47.2 [FreeBSD]
        hwdata: 0.393,1 [FreeBSD]
        hwloc2: 2.11.2 [FreeBSD]
    ...
        screen: 4.9.1_5 [FreeBSD]
        snort3: 3.7.1.0,1 [FreeBSD]
        spdlog: 1.15.2 [FreeBSD]

Number of packages to be installed: 14

The process will require YYY MiB more space.
ZZZ MiB to be downloaded.

Proceed with this action? [y/N]: y
The pkg utility will analyze its package database, detect all dependencies (other libraries and applications that are required for the ones we are asking to install) and display a long list of packages to install. At the end, it will report the amount of disk space required and the amount of data to download from the global repository. Press y, then Enter. The pkg utility will download the packages, unpack them, and install them on the system. During the process, a message like this will appear:
[1/144] Fetching snort3-3.7.1.0,1.pkg: 100%    2 MiB   1.2MB/s    00:02
[2/144] Fetching luajit-devel-2.1.0.20250311.pkg: 100%  480 KiB 491.3kB/s    00:01
[3/144] Fetching hwloc2-2.11.2.pkg: 100%    3 MiB   1.5MB/s    00:02
[4/144] Fetching screen-4.9.1_5.pkg: 100%  568 KiB 581.8kB/s    00:01
...
[1/144] Installing screen-4.9.1_5...
[1/144] Extracting screen-4.9.1_5: 100%
[2/144] Installing snort3-3.7.1.0,1...
[2/144] Extracting snort3-3.7.1.0,1: 100%
[3/144] Installing e2fsprogs-libuuid-1.47.2...
[3/144] Extracting e2fsprogs-libuuid-1.47.2: 100%
[4/144] Installing hwloc2-2.11.2...
[4/144] Extracting hwloc2-2.11.2: 100%
...

root@sniffer:/home/sniffer #
You may also see various warning messages from specific packages, which you can safely ignore.
If you encounter any problems during the installation process, i.e. error messages, and pkg stops halfway, you should try to install each package separately by entering the command pkg install package_name. This way, you can find out the name of the problematic package and then try to deal with it individually. It often happens that package names change and you just need to find out the correct name using pkg search.
At the end, we will see the familiar prompt again. This means that everything is ready!
Further system configuration via the console (the console is traditionally called the keyboard and monitor connected directly to the system) is extremely inconvenient, since the console does not allow copying pieces of text or commands. In order to simplify the work, you should connect to the system via the network, via WiFi, using the remote access protocol to the shell – SSH (Secure Shell). To do this, you need to have an SSH client on your work computer. If you are a user of a Unix system (Linux, *BSD), then there will be no problems – the ssh utility is probably present in your system. For Windows users, you need to install an SSH client called putty.exe (you can download it from the link), or similar.
Before performing a remote connection via SSH, you need to determine the IP address of the sniffer in the Wi-Fi network. This is easy to do: the ifconfig wlan0 command displays complete information about the network interface, including the assigned IP address.
For example, if the interface is assigned the address 192.168.168.140, then to connect to the sniffer from the working machine via SSH, you need to use the corresponding command with this address:
% ssh [email protected]
For putty.exe users, everything is a little more complicated – you need to create a new session, specify the username and IP address of the host, save this session and only then click Connect. You can read more about using this utility on the PuTTY project website.
During the connection process, when connecting for the first time, the SSH client will ask you to confirm your intention to connect to the specified host and only then will it ask you to enter a password. Enter reffins and if everything went well, we will see the same invitation (motd) from the system, followed by the same prompt:
sniffer@sniffer:~ %
For the sake of interest, let’s ask the system who we are and where we’re from, enter the who command:
sniffer@sniffer:~ % who
sniffer          pts/0        Jul 10 07:01 (192.168.171.1)
sniffer@sniffer:~ %
We will get administrator privileges, for this we run:
sniffer@sniffer:~ % su
Password: 1234
root@sniffer:/home/sniffer #
Now you can safely disconnect the keyboard and monitor and hide them in a corner (but not far away), we most likely will not need them, since we will continue to work via SSH, but it is worth keeping them near the talismans that drive away evil spirits. 😉
In order not to constantly be in a shell with administrator (root) rights, which can be dangerous due to the possibility of accidentally destroying the system with an incorrectly entered command, it is customary to use the sudo utility (or its analogue doas). The sudo utility allows you to temporarily elevate administrator privileges for one command, which is passed to it as parameters, and drop them after completion.
We have just installed the sudo utility along with a number of other packages, but this is not enough for the sniffer user to be able to use it. We need to uncomment one line in the configuration file /usr/local/etc/sudo.conf, but we will edit it using the visudo utility (which is part of the sudo package).
First, we will tell the system to use the ee editor to edit text files. This is done by setting the EDITOR environment variable:
root@sniffer:/home/sniffer # setenv EDITOR /usr/bin/ee
Now we call visudo to edit the configuration file:
root@sniffer:/home/sniffer # visudo
The visudo utility will launch the ee editor and load the current contents of the configuration file. Be extremely careful here so as not to accidentally change anything unnecessary! Find a line in the text like this:
## Uncomment to allow members of group wheel to execute any command
# %wheel ALL=(ALL:ALL) ALL
and before the symbols %wheel we remove the symbol #. This means that this line will take effect. Its action is reduced to the fact that the sudo utility will allow any user belonging to the wheel group to execute any command on behalf of root. Let me remind you that when we created the sniffer user in the system, we added it to the wheel and network groups. As a result of editing the line should look like this:
%wheel ALL=(ALL:ALL) ALL
Press ESC, Enter, and then Enter again to save the changes to the file and exit ee. From now on, sudo will allow the sniffer user to execute commands as root, that is, with administrator privileges.
To find out which groups the sniffer user belongs to, you can use the id command as follows:
root@sniffer:/home/sniffer # id sniffer
uid=1002(sniffer) gid=1002(sniffer) groups=1002(sniffer),0(wheel),69(network)
The id command displays all the system IDs for the specified user. Here we see that the sniffer user is a member of three groups: sniffer, wheel, and network. Note that the wheel group has ID 0, which is the administrators group.
If you forget to add the sniffer user to the right group, you can do so at any time with the pw usermod command:
root@sniffer:/home/sniffer # pw usermod sniffer -G wheel,network
This command sets (overwrites) the sniffer user group list.
Let’s check how sudo works. To do this, first exit the administrator shell by entering the exit command, that is, return to a shell without privileges:
root@sniffer:/home/sniffer # exit
exit
sniffer@sniffer:~ %
Next, run the id command as administrator:
sniffer@sniffer:~ % sudo id

We trust you have received the usual lecture from the local System
Administrator. It usually boils down to these three things:

    #1) Respect the privacy of others.
    #2) Think before you type.
    #3) With great power comes great responsibility.

For security reasons, the password you type will not be visible.
Password: reffins
uid=0(root) gid=0(wheel) groups=0(wheel),5(operator)
First, sudo will warn you that you are trying to gain administrator privileges, which carries some responsibility and you should proceed with caution. This warning will appear only once during the first use. Next, sudo will ask you for the password of the sniffer user. If the entered password is correct, the id command is executed with root user rights. This is visible from the identifiers uid=0(root) gid=0(wheel), displayed by this command.
If suddenly sudo issues a message:
sniffer is not in the sudoers file.
This incident has been reported to the administrator.
This means that the sniffer user is not a member of the wheel group, or there is an error in the configuration file. You should run visudo again and check for the %wheel line.
Next, we will work in a shell from the sniffer user without privileges, the prompt should look like this: sniffer@sniffer:~ %. And when we need to execute a command that requires administrator privileges, we will use sudo.
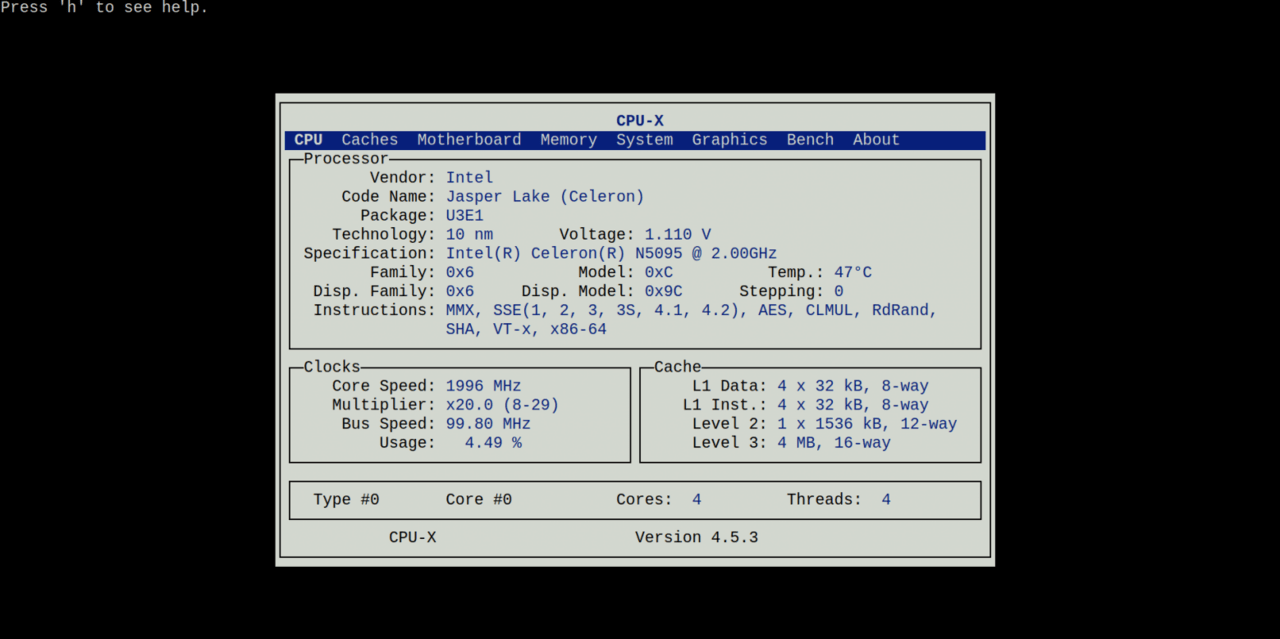
Before moving on to the network settings, you should study the hardware we have a little. As mentioned above, the Horizon N5 single-board mini-PC is equipped with an Intel Celeron N5105 microprocessor. Let’s see what our system knows about it. To do this, we will use the wonderful cpu-x utility. This utility has two operating modes: interactive and command.
If you run cpu-x without parameters, it will switch to interactive mode with a multi-screen text menu. By moving around the menu with the cursor arrows, you can observe changes in the CPU clock frequency, bus speeds, caches, and RAM in real time.
To get all the information at once, you can specify the -D switch. In both cases, you should run the cpu-x utility with administrator privileges, for example:
sniffer@sniffer:~ % sudo cpu-x
Password: reffins
After that, a window with a text menu will appear as in Fig. 7.
Or in command mode to get a complete listing with a description of the hardware. Enter the command:
sniffer@sniffer:~ % sudo cpu-x -D
And we get:
>>>>>>>>>> CPU <<<<<<<<<<

        ***** Processor *****
          Vendor: Intel
       Code Name: Jasper Lake (Celeron)
         Package: U3E1
      Technology: 10 nm
         Voltage: 1.110 V
   Specification: Intel(R) Celeron(R) N5095 @ 2.00GHz
          Family: 0x6
    Disp. Family: 0x6
           Model: 0xC
     Disp. Model: 0x9C
           Temp.: 48°C
        Stepping: 0
    Instructions: MMX, SSE(1, 2, 3, 3S, 4.1, 4.2), AES, CLMUL, RdRand, SHA, VT-x, x86-64

        ***** Clocks *****
      Core Speed: 1996 MHz
      Multiplier: x20.0 (8-29)
       Bus Speed: 99.80 MHz
           Usage:   0.39 %

        ***** Cache *****
         L1 Data: 4 x 32 kB, 8-way
        L1 Inst.: 4 x 32 kB, 8-way
         Level 2: 1 x 1536 kB, 12-way
         Level 3: 4 MB, 16-way

        ***** * *****
           Cores: 4
         Threads: 4


  >>>>>>>>>> Caches <<<<<<<<<<

        ***** L1 Cache *****
            Size: 4 x 32 kB, 8-way associative, 64-bytes line size
           Speed: 83410.70 MB/s

        ***** L2 Cache *****
            Size: 1 x 1536 kB, 12-way associative, 64-bytes line size
           Speed: 35808.30 MB/s

        ***** L3 Cache *****
            Size: 4 MB, 16-way associative, 64-bytes line size
           Speed: 24022.30 MB/s


  >>>>>>>>>> Motherboard <<<<<<<<<<

        ***** Motherboard *****
    Manufacturer: Rombica
           Model: Default string
        Revision: Default string

        ***** BIOS *****
           Brand: American Megatrends International, LLC.
         Version: T9PRO001
            Date: 10/23/2024
        ROM Size: 64 kB / 5 MB

        ***** Chipset *****
          Vendor: Intel Corporation
           Model: Jasper Lake eSPI Controller


  >>>>>>>>>> Memory <<<<<<<<<<

        ***** Bank 0 *****
       Reference: Samsung                   , 6 GB @ 3733 MT/s (Row Of Chips LPDDR4)

        ***** Bank 1 *****
       Reference: Samsung                   , 6 GB @ 3733 MT/s (Row Of Chips LPDDR4)


  >>>>>>>>>> System <<<<<<<<<<

        ***** Operating System *****
          Kernel: 14.3-RELEASE
    Distribution: FreeBSD
        Hostname: sniffer
          Uptime: 0 days, 1 hours, 54 minutes, 50 seconds
        Compiler: FreeBSD clang version 19.1.7 (https://github.com/llvm/llvm-project.git llvmorg

        ***** Memory *****
            Used: 0.90 GiB / 11.46 GiB
         Buffers: 0.00 GiB / 11.46 GiB
          Cached: 0.00 GiB / 11.46 GiB
            Free: 10.55 GiB / 11.46 GiB
            Swap: 0.00 GiB / 4.00 GiB


  >>>>>>>>>> Graphics <<<<<<<<<<

        ***** Card 0 *****
          Vendor: Intel
          Driver:
     UMD Version:
           Model: JasperLake [UHD Graphics]
    Compute Unit:
        DeviceID: 0x4E55:0x01
   VBIOS Version:
       Interface:
     Temperature:
           Usage:
    Core Voltage:
       Power Avg:
       GPU clock:
    Memory clock:
     Memory Used:
   Resizable BAR:
       Vulkan RT:
  OpenGL Version:
  Vulkan Version:
  OpenCL Version:
The Coremark test allows you to measure the peak performance of the system in some relative units, which are expressed in the number of iterations of the main cycle per second of time. Knowing this parameter for the tested system, you can compare it with other known computing systems and complexes and estimate the load that this system can handle. The Coremark test replaced the Dhrystone test and is considered more relevant for modern computing systems. The Coremark test is a program written in C, and it is distributed in source code. This program must be compiled before running, which can be done with different optimization parameters, and therefore the test can show very different results. Therefore, when comparing results, you should always pay attention to the compilation options.
You can get the source code of the test from the Github repository with the following command:
sniffer@sniffer:~ % git clone https://github.com/eembc/coremark.git
Cloning into 'coremark'...
remote: Enumerating objects: 412, done.
remote: Counting objects: 100% (175/175), done.
remote: Compressing objects: 100% (70/70), done.
remote: Total 412 (delta 136), reused 115 (delta 105), pack-reused 237 (from 2)
Receiving objects: 100% (412/412), 542.69 KiB | 1.51 MiB/s, done.
Resolving deltas: 100% (234/234), done.
Administrator privileges are not required. Compiling and running the test is done with a single command:
sniffer@sniffer:~ % cd coremark && gmake
This will execute two runs of the test with slightly different parameters. The test results will be placed in the files ./run1.log and ./run2.log . We are interested in the first run (performance). To display the result, we will use the cat command:
sniffer@sniffer:~/coremark % cat run1.log

2K performance run parameters for coremark.
CoreMark Size    : 666
Total ticks      : 16601
Total time (secs): 16.601000
Iterations/Sec   : 18071.200530
Iterations       : 300000
Compiler version : FreeBSD Clang 19.1.7 (https://github.com/llvm/llvm-project.git llvmorg-19.1.7-0-gcd708029e0b2)
Compiler flags   : -O2 -DPERFORMANCE_RUN=1  -lrt
Memory location  : Please put data memory location here
                        (e.g. code in flash, data on heap etc)
seedcrc          : 0xe9f5
[0]crclist       : 0xe714
[0]crcmatrix     : 0x1fd7
[0]crcstate      : 0x8e3a
[0]crcfinal      : 0xcc42
Correct operation validated. See README.md for run and reporting rules.
CoreMark 1.0 : 18071.200530 / FreeBSD Clang 19.1.7 (https://github.com/llvm/llvm-project.git llvmorg-19.1.7-0-gcd708029e0b2) -O2 -DPERFORMANCE_RUN=1  -lrt / Heap
The number we are interested in is in bold and is 18071 units. This figure is often converted to normalized units per 1 MHz. In our case, this number should be divided by the clock frequency 1999. We get 9.0 Coremark units/MHZ.
It is important that by default the program tests only one computing core. To check the total performance of all cores, it is necessary to parallelize the test for the number of microprocessor cores. According to the cpu-x utility, the Intel Celeron N5095 microprocessor has 4 parallel program execution threads. Let’s run the test on all four threads:
sniffer@sniffer:~/coremark % gmake clean
rm -f ./coremark.exe ./core_list_join.o ./core_main.o ./core_matrix.o ./core_state.o ./core_util.o ./*.log *.info ./index.html

sniffer@sniffer:~/coremark % gmake XCFLAGS="-DMULTITHREAD=4 -DUSE_FORK"

sniffer@sniffer:~/coremark % cat run1.log
2K performance run parameters for coremark.
CoreMark Size    : 666
Total ticks      : 16682
Total time (secs): 16.682000
Iterations/Sec   : 71933.820885
Iterations       : 1200000
Compiler version : FreeBSD Clang 19.1.7 (https://github.com/llvm/llvm-project.git llvmorg-19.1.7-0-gcd708029e0b2)
Compiler flags   : -O2 -DMULTITHREAD=4 -DUSE_FORK -DPERFORMANCE_RUN=1  -lrt
Parallel Fork : 4
Memory location  : Please put data memory location here
                        (e.g. code in flash, data on heap etc)
seedcrc          : 0xe9f5
[0]crclist       : 0xe714
[1]crclist       : 0xe714
[2]crclist       : 0xe714
[3]crclist       : 0xe714
[0]crcmatrix     : 0x1fd7
[1]crcmatrix     : 0x1fd7
[2]crcmatrix     : 0x1fd7
[3]crcmatrix     : 0x1fd7
[0]crcstate      : 0x8e3a
[1]crcstate      : 0x8e3a
[2]crcstate      : 0x8e3a
[3]crcstate      : 0x8e3a
[0]crcfinal      : 0xcc42
[1]crcfinal      : 0xcc42
[2]crcfinal      : 0xcc42
[3]crcfinal      : 0xcc42
Correct operation validated. See README.md for run and reporting rules.
CoreMark 1.0 : 71933.820885 / FreeBSD Clang 19.1.7 (https://github.com/llvm/llvm-project.git llvmorg-19.1.7-0-gcd708029e0b2) -O2 -DMULTITHREAD=4 -DUSE_FORK -DPERFORMANCE_RUN=1  -lrt / Heap / 4:Fork
As a result, we get 71933 Coremark for all four cores.
To understand whether this is a lot or a little, you can compare it with similar measurements made for well-known systems. Ready-made measurements can be viewed on the EEMBC website. For comparison, the RaspberryPI 5 with a clock frequency of 2.5 MHz produces 72,059 units, and my Lenovo laptop with an AMD Ryzen5 processor and a frequency of 3.3 GHz produces 303,116 Coremark units. It is obvious that the mini-PC at our disposal is not inferior to the popular single-board PC RaspberryPI 5, but lags behind serious desktop systems by almost an order of magnitude.
It has long been known that the bottleneck in modern computing systems is memory, its insufficient speed can radically reduce the performance of the entire system. The STREAM test consists of four operations: measuring the performance of the copy operation (copy), scale (scale), add (add) and complex operations: scale + add + forward (triad). Like the Coremark test, the STREAM test is an established industry standard, you can read more about it at the link: https://documentation.sigma2.no/jobs/arm-perf/stream.html
The STEAM test is also distributed in source code, so to perform memory performance measurements on our device, we clone the repository in a similar way:
sniffer@sniffer:~ % git clone https://github.com/jeffhammond/STREAM.git

Cloning into 'STREAM'...
remote: Enumerating objects: 89, done.
remote: Counting objects: 100% (38/38), done.
remote: Compressing objects: 100% (14/14), done.
remote: Total 89 (delta 31), reused 24 (delta 24), pack-reused 51 (from 2)
Receiving objects: 100% (89/89), 32.88 KiB | 320.00 KiB/s, done.
Resolving deltas: 100% (50/50), done.
Let’s go to the subdirectory with the source code and compile:
sniffer@sniffer:~ % cd STREAM && gmake
As a result of the compilation, we have an executable file named stream_c.exe. Let’s run it:
sniffer@sniffer:~/STREAM % ./stream_c.exe

-------------------------------------------------------------
STREAM version $Revision: 5.10 $
-------------------------------------------------------------
This system uses 8 bytes per array element.
-------------------------------------------------------------
Array size = 10000000 (elements), Offset = 0 (elements)
Memory per array = 76.3 MiB (= 0.1 GiB).
Total memory required = 228.9 MiB (= 0.2 GiB).
Each kernel will be executed 10 times.
 The *best* time for each kernel (excluding the first iteration)
 will be used to compute the reported bandwidth.
-------------------------------------------------------------
Number of Threads requested = 4
Number of Threads counted = 4
-------------------------------------------------------------
Your clock granularity/precision appears to be 1 microseconds.
Each test below will take on the order of 7411 microseconds.
   (= 7411 clock ticks)
Increase the size of the arrays if this shows that
you are not getting at least 20 clock ticks per test.
-------------------------------------------------------------
WARNING -- The above is only a rough guideline.
For best results, please be sure you know the
precision of your system timer.
-------------------------------------------------------------
Function    Best Rate MB/s  Avg time     Min time     Max time
Copy:           14527.0     0.011080     0.011014     0.011218
Scale:          13139.5     0.012274     0.012177     0.012343
Add:            12786.4     0.018830     0.018770     0.018882
Triad:          12819.8     0.018799     0.018721     0.018890
-------------------------------------------------------------
Solution Validates: avg error less than 1.000000e-13 on all three arrays
-------------------------------------------------------------
As a result, we see that copy operations are performed at a speed of about 14 GB/sec. For comparison, on my Lenovo laptop this figure reaches 18 GB/sec, but it should be noted that the Horizon N5 uses high-speed LPDDR4 memory, the same as in my laptop, so the results are very close. On serious server platforms, the STREAM test can show 120 GB/sec (and more) for copy operations.
Another interesting point and side result of measuring performance using STREAM is the error rate, which shows the reliability of the entire RAM subsystem. In the example given, the test shows that the error rate is less than 1.000000e-13, that is, they were not recorded at all. A good sign!
We have dealt with the hardware part and drawn the appropriate conclusions. The computing resources of the system are quite enough to carry out simple traffic measurements and even analyze it “on the fly.”
At the next stage of configuring the sniffer, it is important to determine the method of remote access to the device. There are different approaches, but in most cases, the SSH protocol is used to manage Unix systems, which is a de facto standard and provides a secure communication channel.
Windows users are usually more familiar with RDP, and this option can also be implemented, but for the purposes of this project, the main focus is on SSH.
In Unix systems, SSH connection is carried out using the ssh command of the same name, which is included in the OpenSSH package. This package is part of many operating systems and is already installed during the installation process. The ssh command accepts a mandatory parameter of the form username@hostname or username@xxxx, where xxxx is the IP address of the machine. With username, everything is clear, this is the username in the system, in our case it is the sniffer user. But with the IP address (and especially with the host name, which can be converted to an IP address) there are a number of problems. How can we find out what IP address the sniffer machine has when it is installed, for example, in a subscriber’s apartment? Moreover, even if we find out this IP, there is no benefit from this knowledge, since the subscriber’s home network always uses “fake”, i.e. publicly non-routed IP addresses, and the subscriber himself is behind one or more address translators (NAT – Network Address Translation). All this does NOT allow you to establish a connection with the sniffer host located inside the subscriber’s home network, being outside it. But what to do?
There are several solutions. You can use the tools of ssh itself to organize a reverse tunnel (SSH Reverse Tunneling) using the -R option to a known and publicly available Unix host to which you have access. This solution is not simple in that it requires skills in using Unix systems and understanding the process that is taking place, so we will not consider it here. Those interested can read the instructions for setting up a reverse tunnel on the Internet.
Instead, let’s consider a more traditional method – organizing a tunnel to a known public host using PPTP (or L2TP) protocols, widely known as Virtual Private Network (VPN). This technology allows you to combine company hosts scattered across the global network into a single network. The advantage of VPN technology is that you don’t need to organize your own PPTP/L2TP server, just contact your nearest Internet service provider with a request to organize an account with a fixed public IP address for your business needs. Such a service will not be free, but it will eliminate a lot of problems. Of course, you can also rent a virtual server with Linux OS from an Internet provider and organize your own business VPN server on it, but this is a topic for a separate conversation.
In short, let’s assume that the problem of obtaining an account on the VPN server has been somehow miraculously solved and you have four lines of text: the IP address of the PPTP server, let it be 1.2.3.4, the username: pptp_username and the password: pptp_password. We also know that after establishing a connection with the server on the client side, the same public IP address 4.3.2.1 will always be set.
Our task at this stage is to configure a PPTP or L2TP client on the sniffer machine. It should be noted that the organization of tunnels using the PPTP and L2TP protocols in the FreeBSD operating system is handled by the daemon (background utility) mpd5, which was installed earlier. In fact, all the work on encapsulating traffic is done by the netgraph subsystem (type the command man 4 netgraph for a more detailed look), and mpd5 is just the tip of the iceberg, performing authorization and configuring the network interface.
All the settings of the mpd5 daemon are located in the /usr/local/etc/mpd5/ directory, usually there are only three files: mpd.conf, mpd.script and mpd.secret. We need to make changes to the mpd.conf file – add a section with a description of the connection, and create two new script files. One script (let’s call it ifup.sh) to add specific routes to the routing table when a connection is established, and the other (ifdown.sh) to remove them when a connection is disconnected. We also need to make changes to the operating system configuration file /etc/rc.conf to auto-start mpd5 when the OS boots.
Using the ee editor as root, open the /usr/local/etc/mpd5/mpd.conf file with the command:
sniffer@sniffer:~ % sudo ee /usr/local/etc/mpd5/mpd.conf
Copy to the clipboard and paste the following text at the beginning of the file:
startup:
        log +ALL +EVENTS -FRAME -ECHO

default:
        load PPTP

L2TP:
        create bundle static B1

        set iface up-script /usr/local/etc/mpd5/ifup.sh
        set iface down-script /usr/local/etc/mpd5/ifdown.sh

        set iface enable tcpmssfix
        set ipcp yes vjcomp

        set ccp yes mppc
        set mppc yes e128
        set mppc yes stateless

        create link static L1 l2tp
        set link action bundle B1
        set link max-redial 0
        set link mtu 1460
        set link keep-alive 20 75
        set link accept chap-msv2

        set l2tp peer 1.2.3.4
        set auth authname "l2tp_username"
        set auth password "l2tp_password"

        open

PPTP:

        create bundle static B1
        set bundle enable compression
        set ccp yes mppc
        set mppc no e40
        set mppc yes e128
        set mppc yes stateless

        set iface up-script /usr/local/etc/mpd5/ifup.sh
        set iface down-script /usr/local/etc/mpd5/ifdown.sh

        create link static L1 pptp
        set link action bundle B1
        set link max-redial 0
        set link mtu 1460
        set link keep-alive 20 75
        set pptp disable windowing

        set pptp peer 1.2.3.4
        set auth authname "pptp_username"
        set auth password "pptp_password"

        open
Before saving, you need to replace the server IP address, username and password, and also choose which of the two protocols will be used. We find the following lines:
set l2tp peer 1.2.3.4
       set auth authname "l2tp_username"
       set auth password "l2tp_password"

       set pptp peer 1.2.3.4
       set auth authname "pptp_username"
       set auth password "pptp_password"
And replaces the parameter values with the actual ones received from the Internet provider.
To select the protocol, at the beginning we look for the lines:
default:
        load PPTP
And replace load PPTP with load L2PT if you want to use the L2PT protocol. Otherwise, leave it as is. Exit the ee editor, as usual, by pressing ESC, Enter, Enter.
The next step is to create the script files to bring up the network interface. First, open the ifup.sh file in the ee editor:
sniffer@sniffer:~ % sudo ee /usr/local/etc/mpd5/ifup.sh
Copy and paste the following text into it:
#!/bin/sh
echo $* > /tmp/.mpd5.$1
wanip=`/sbin/route -n get default | sed -rn 's/gateway: (.*)/\1/p'`
echo $wanip > /tmp/.defaultgateway
localip=$3
remoteip=$4
serverip=$8
echo localip=$3 remoteip=$4 serverip=$8 >> /tmp/.mpd5.$1
/sbin/route delete $serverip
/sbin/route add $serverip $wanip
/sbin/route delete default
/sbin/route add default $remoteip
Save the file (ESC, Enter, Enter) and then open another file ifdown.sh :
sniffer@sniffer:~ % sudo ee /usr/local/etc/mpd5/ifdown.sh
Copy and paste the following text into it:
#!/bin/sh
wanip=`cat /tmp/.defaultgateway`
/sbin/route delete $4
/sbin/route delete default
/sbin/route add default $wanip
rm /tmp/.defaultgateway
And also save.
Now we need to add mpd5 to auto-start so that when the operating system boots, this utility starts and immediately establishes a connection to the VPN server, thus organizing an access channel to the machine for us.
In the FreeBSD OS, the process of auto-starting programs, and many other aspects of system boot, are controlled by a set of scripts, which are usually called rc – after the main script. Auto-start settings are placed in the /etc/rc.conf file. This file can be edited with a regular text editor ( ee ), but it is not customary to do so for a completely understandable reason – an imperceptible error in this file threatens to take the system out of service. In order to make changes to the configuration file in a safe way, a separate sysrc utility is used.
Use the sysrc utility to add mpd5 to /etc/rc.conf , execute the following commands:
sniffer@sniffer:~ % sudo sysrc mpd_enable="YES"
Password:
mpd_enable:  -> YES

sniffer@sniffer:~ % sudo sysrc mpd_flags="-b"
mpd_flags:  -> -b
The last command adds the -b flag to /etc/rc.conf which will be passed to the mpd5 utility at startup and signals it to run in the background (i.e. as a daemon).
Now we can run mpd5 and see what we got. System daemons, i.e. those controlled by rc, are started in FreeBSD by the service utility. We start mpd5 with the following command:
sniffer@sniffer:~ % sudo service mpd5 start
Starting mpd5.
If it went smoothly, i.e. there are no typos in the configs, and all the settings (server IP address, username and password) are correct, then another network interface named ng0 should appear in the system. You can view its parameters with the ifconfig ng0 command (root privileges are not required to view it):
sniffer@sniffer:~ % ifconfig ng0
ng0: flags=10088d1<UP,POINTOPOINT,RUNNING,NOARP,SIMPLEX,MULTICAST,LOWER_UP> metric 0 mtu 1456
        options=0
        inet 192.168.176.135 --> 192.168.176.1 netmask 0xffffffff
        nd6 options=29<PERFORMNUD,IFDISABLED,AUTO_LINKLOCAL>
Here we see that the server gave me the IP address 192.168.176.135. In your case, the fixed public IP address that was given to you by your provider should be displayed here, i.e. 4.3.2.1.
If something went wrong and there is nothing on the interface instead of the IP address, i.e. something like this:
sniffer@sniffer:~ % ifconfig ng0
ifconfig: interface ng0 does not exist
This means that mpd5 is not running or even installed.
Or like this:
sniffer@sniffer:~ % ifconfig ng0
ng0: flags=8890<POINTOPOINT,NOARP,SIMPLEX,MULTICAST> metric 0 mtu 1500
        options=0
        nd6 options=29<PERFORMNUD,IFDISABLED,AUTO_LINKLOCAL>
This means that mpd5 started, but it was unable to establish a PPTP or L2TP connection. To find out the reason, you need to look into the log file /var/log/daemon.log, where the mpd5 utility produces a huge amount of diagnostic information. Using the grep utility, we will select information from this file regarding the connection establishment:
For example:
sniffer@sniffer:~ % grep mpd /var/log/daemon.log

...
Jul 10 09:04:48 sniffer mpd[2986]: [L1] CHAP: Using authname "Sniffer"
Jul 10 09:04:48 sniffer mpd[2986]: [L1] CHAP: sending RESPONSE #1 len: 61
Jul 10 09:04:48 sniffer mpd[2986]: [L1] CHAP: rec'd FAILURE #1 len: 31
Jul 10 09:04:48 sniffer mpd[2986]: [L1]   MESG: E=691 R=0 M=Login incorrect
Jul 10 09:04:48 sniffer mpd[2986]: [L1] LCP: authorization failed
Jul 10 09:04:48 sniffer mpd[2986]: [L1] LCP: parameter negotiation failed
Jul 10 09:04:48 sniffer mpd[2986]: [L1] LCP: state change Opened --> Stopping
Jul 10 09:04:48 sniffer mpd[2986]: [L1] LCP: phase shift AUTHENTICATE --> TERMINATE
Jul 10 09:04:48 sniffer mpd[2986]: [L1] AUTH: Cleanup
...
This log shows that an attempt was made to use the username Sniffer, which resulted in the message “Logging incorrect” due to a typo in the first character. You need to open the file /usr/local/etc/mpd5/mpd.conf in the ee editor and fix the error, then run the command to restart mpd5:
sniffer@sniffer:~ % sudo service mpd5 restart
Stopping mpd5.
Waiting for PIDS: 2986.
Starting mpd5.
and check immediately:
sniffer@sniffer:~ % ifconfig ng0
ng0: flags=10088d1<UP,POINTOPOINT,RUNNING,NOARP,SIMPLEX,MULTICAST,LOWER_UP> metric 0 mtu 1456
        options=0
        inet 192.168.176.135 --> 192.168.176.1 netmask 0xffffffff
        nd6 options=29<PERFORMNUD,IFDISABLED,AUTO_LINKLOCAL>
If everything is OK, the IP address on the ng0 interface is present, then you can connect to the sniffer at this IP address with the following command from your work PC:
$ ssh [email protected]
where 4.3.2.1 is the IP address on the tunnel interface, assigned by your ISP. In my case, it is 192.168.176.135, it is local to my network and used for demonstration purposes only.
From this moment on, you have the ability to remotely connect to the sniffer via the Internet, and the sniffer user password should be changed to something more secure or use asymmetric key authentication.
In the first part, we went through the entire fundamental path — from the emergence of the very idea of an autonomous network sniffer to the full preparation of a system environment based on FreeBSD. In practice, it was shown what equipment is suitable for creating a compact diagnostic tool, how to install the operating system, perform initial setup, connect via SSH and prepare the necessary packages for further work. We examined the hardware capabilities of a mini-PC, conducted basic performance tests and made sure that even compact devices are able to provide sufficient resources for network traffic analysis.
All this forms a reliable technical foundation on which the second part will be based — practical work with network interfaces, bridges, tunnels, BPF filters and full traffic analysis.