22.05.2023
11 min
1755

Discover the power of Burp Suite for testers who need comprehensive web vulnerability scanning solutions. Our step-by-step guide describes how to use the advanced capabilities of Web Scanner and Burp Suite Scanner to detect, analyze, and mitigate security threats in web applications.

The term web crawler or web spider is the most common and has been used many times when testing a web application. So what kind of scanner is this??
With its name, we can show that the scanner scans a certain region slowly and deeply and then outputs the result in a defined format.
So Burp’s Crawler is the same thing??
According to port swigger, “The scanning phase involves navigating through the application, following links, submitting forms, and logging in to catalog the application’s content and navigation paths within it.”
Simply put, we can say that the burp scanner programmatically moves within the entire web application, follows the redirect URLs, logs inside the login portals, and then adds them in a tree-like structure in the sitemap view in the Target tab.
However, this scanner functions in the same way as “Dirb” or “DirBuster” tools, web content scanners that scan a web server to remove visited, unvisited, and hidden web application URLs.
Earlier in previous versions of burpsuite like “1.7” we got this scanner called “Spider”. So why did this happen, what new features does the burp scanner have that made the spider disappear??
Scanning with default configurations !!
If you are familiar with the spider feature, you may know that the spider holds a specific tab in the Burpsuite panel. But with the improvements, the burp scanner is already defined in the toolbar section. Still, it helps us track and control the automated belching activity in one place.
So, to get started with the scanner, let’s enable our burpsuite and redirect it to the Dashboard section.
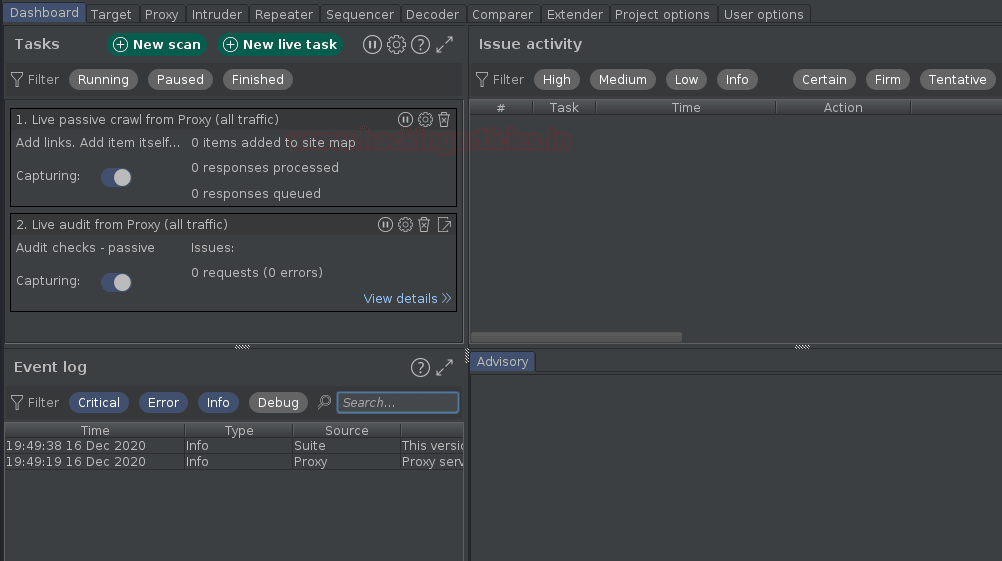
As soon as we get to the toolbar, we see the section number indicated. Let’s take a closer look at them:
Tasks – The Tasks section contains a summary of all current and user-defined or automated scans. Here we can pause and resume individual tasks or all tasks together, and even we can view detailed versions of a particular scan or audit.
Event Log – The event log feature generates all the events that burpsuite monitors, for example if a proxy starts, an event is generated for it, or a specific partition is not working properly, then an event log will be generated from the.
Issue Activity – This section extracts the common vulnerabilities in the application that burpsuite scans, and we can then separate them all by applying defined filters according to their severity and destructiveness.
The advisory is one of the most important sections of the burp dashboard, as it demonstrates the selected vulnerability in a detailed manner, for example by identifying the payload with a query and response, mentioning why it exists, identifying mitigation steps, and delinking and evaluating CVSS for our review.
So to dig the web application we need to click on the New Scan button located at the top of the Tasks section.
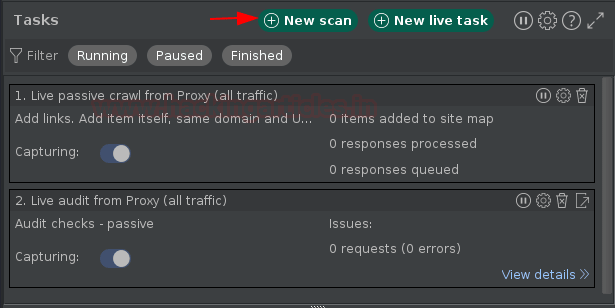
As soon as we do this, we will be redirected to a new pop-up window that says “New Scan”.
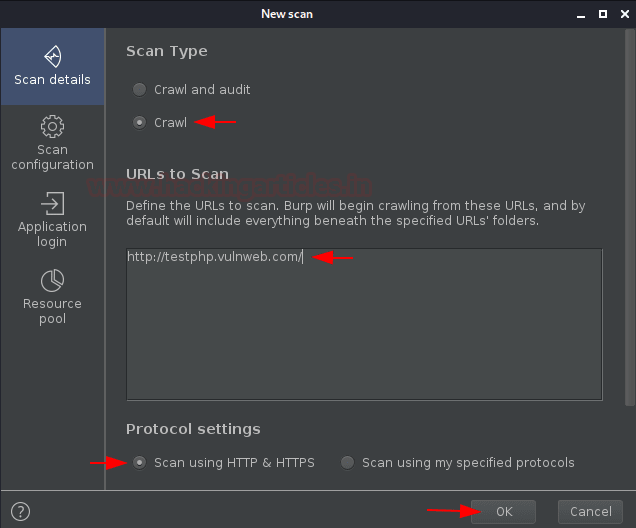
There we will meet two options:
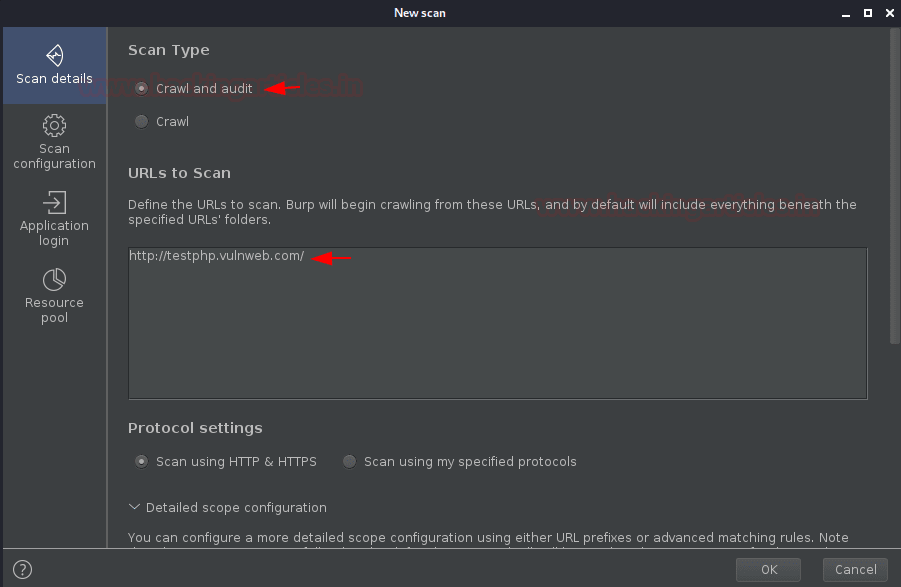
Scanning and auditing
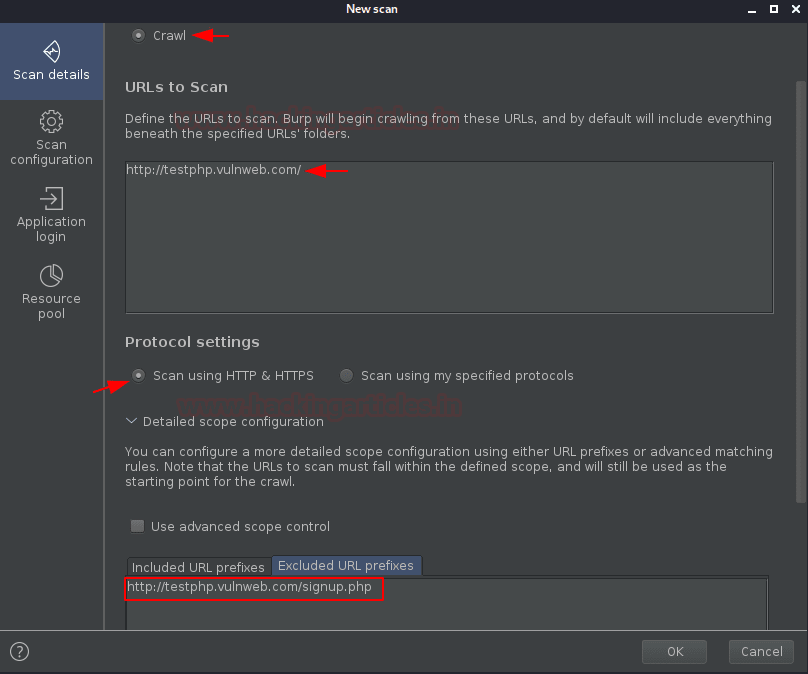
to crawl
However, for this section, we will only do a “Scan” . And we will talk about the other one later in this article. Since we are heading to the default configurations, we will simply enter a test URL like “http://testphp.vulnweb.com/” and click the “OK” button.
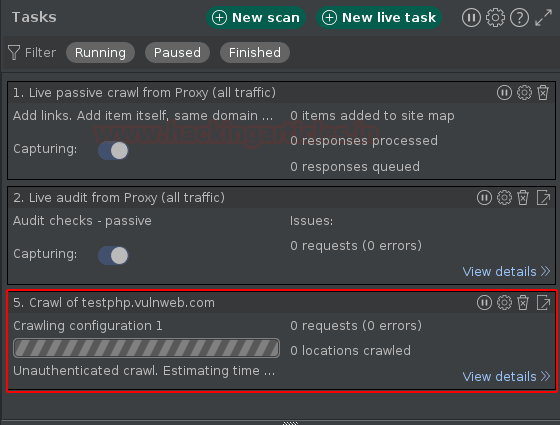
When we do this, the window will disappear and in the dashboard we’ll have our new task lined up as “Scanning test.vulnweb.com” and in the event log we’ll see that we’ve received a “Scan Started” event.
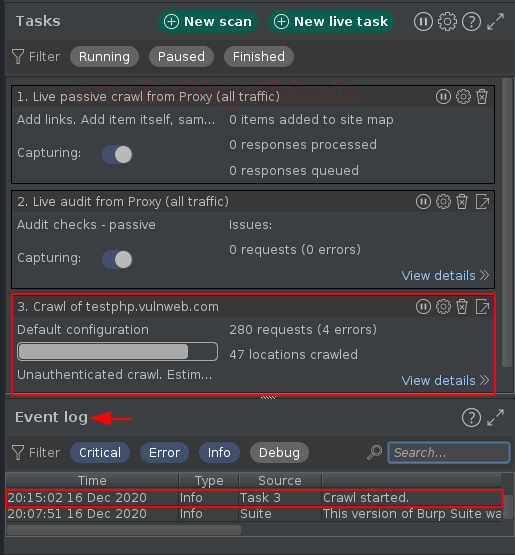
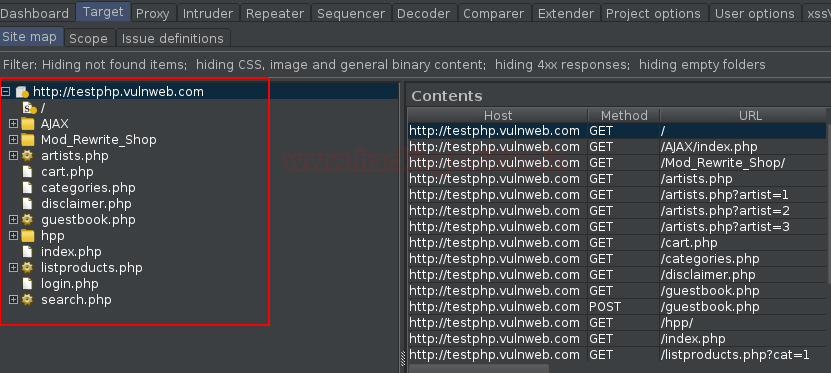
Within a few minutes, the scan task will be completed and we will receive a notification. But where is the result?? As defined earlier, the scanner displays the result in a tree-like format in the “Sitemap” view on the “Target” tab, let’s go there.
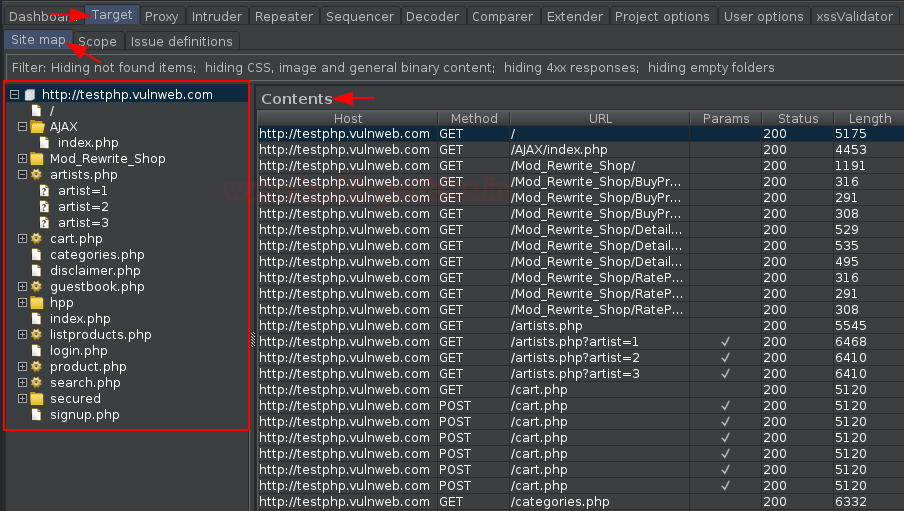
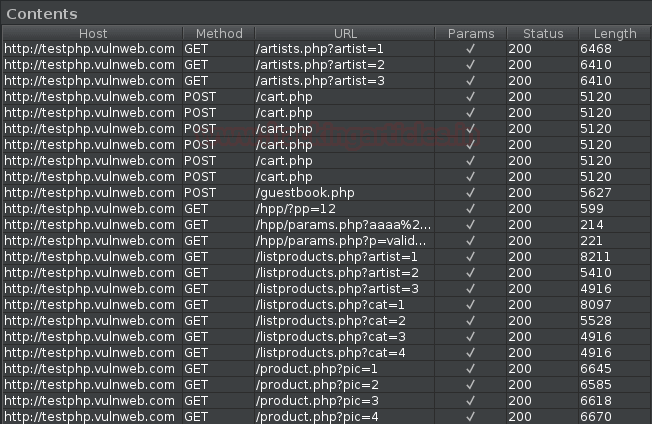
Perfectly!! We got what we wanted. In the right panel we have almost every URL of a web page, along with that it contains HTTP methods and a params section that defines which URL needs a Params value in it.
There are a number of major vulnerabilities due to raw input fields, so with this dumped data we can simply isolate URLs that contain input values, which can then be further validated. And to do this, just double-click the “Options” field.
However, if we want to check pages or a specific directory, we can simply go to the left and select the desired option there.
What if some specific web pages are out of bounds?? Or does the website require certain credentials to view restricted web pages?
So in such cases we need to configure our scanner so that it can work as we want. So, to do this, let’s go back to the dashboard and select the New Scan option again. But for now, we won’t click OK after setting the URL.
Below in the protocol settings there is an option for detailed scope configuration where we simply go to Excluded URL Prefixes and enter the URL outside the scope ie http://testphp.vulnweb.com/signup. php
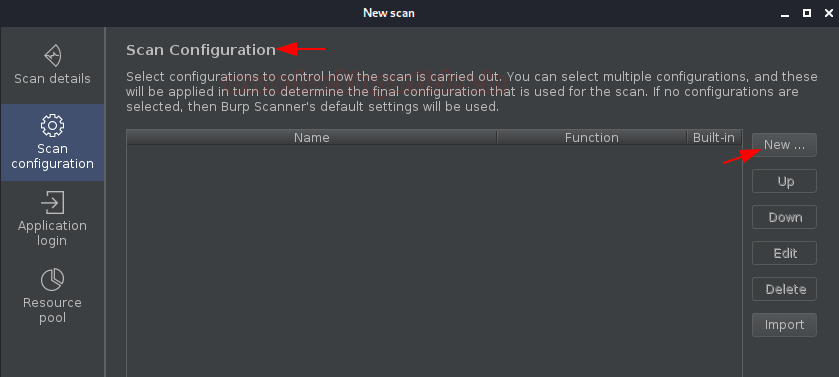
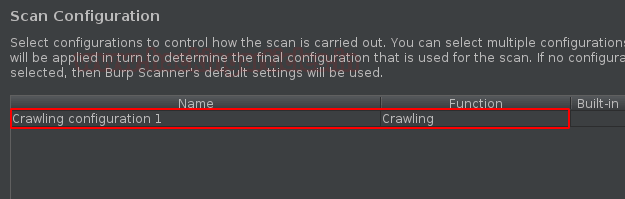
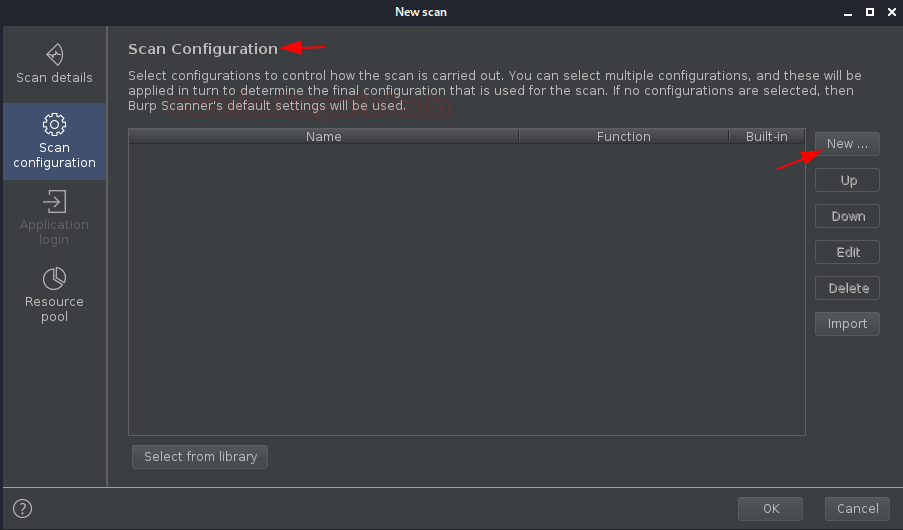
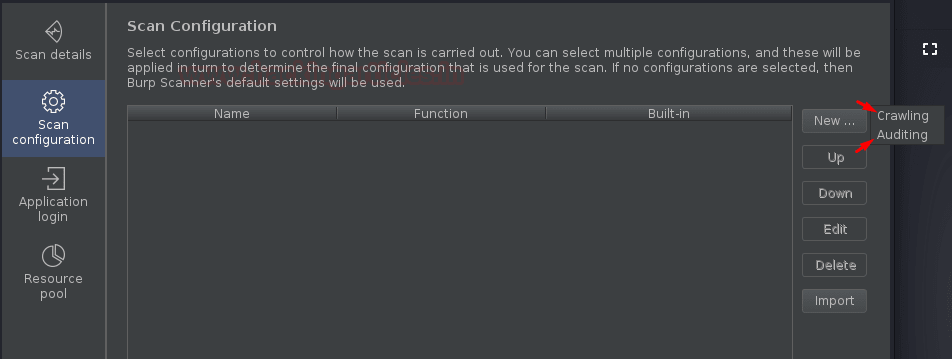
For further customization, we will go to the “Scan Settings” option. And there we click the New button to set up a new scanner.
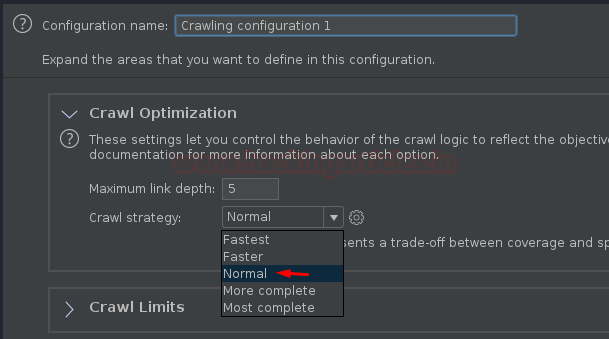
Once we do this, another window will open with configuration options. Let’s leave the default configuration name, but you can change it if you want. Also, the scan optimization option is separated within Fastest to Deepest, so we change it according to our requirements.
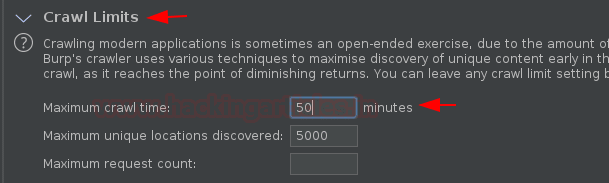
The scan limit is considered to be an important factor as it determines the time and depth required to scan the application. So we’ll set the maximum scan limit to 50 minutes and the maximum number of unique locations detected to 5,000.
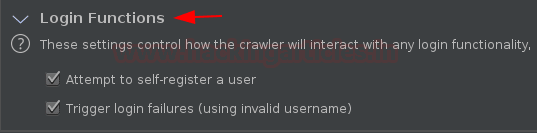
There are programs that do user registration or login portals, so by checking both options, the burp scanner will self-register with some random values if it encounters a registration portal and even use incorrect credentials on login portals, for example to determine the behavior of web site
Now with all these configurations, as soon as we click the Save button, we get our scanner listed in the new scan toolbar.
What to do if the scanner encounters restricted pages? Or the admin portal? So, for those situations, let’s provide some default credentials for the scanner to use!!
Go to Application Login and click New.
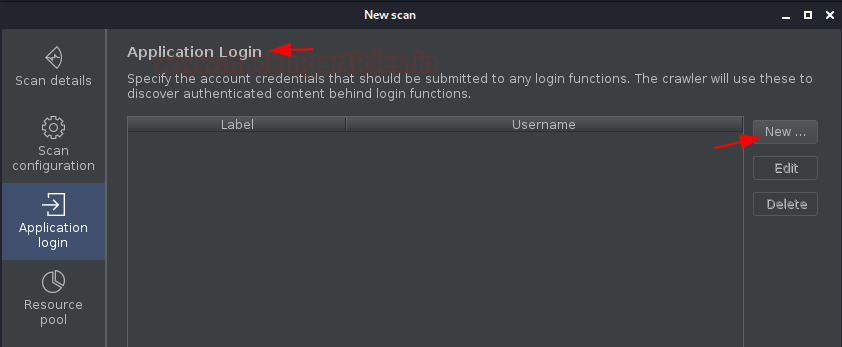
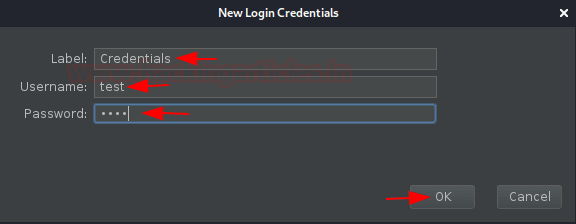
In the pop-up window, enter the required credentials and click the OK button.
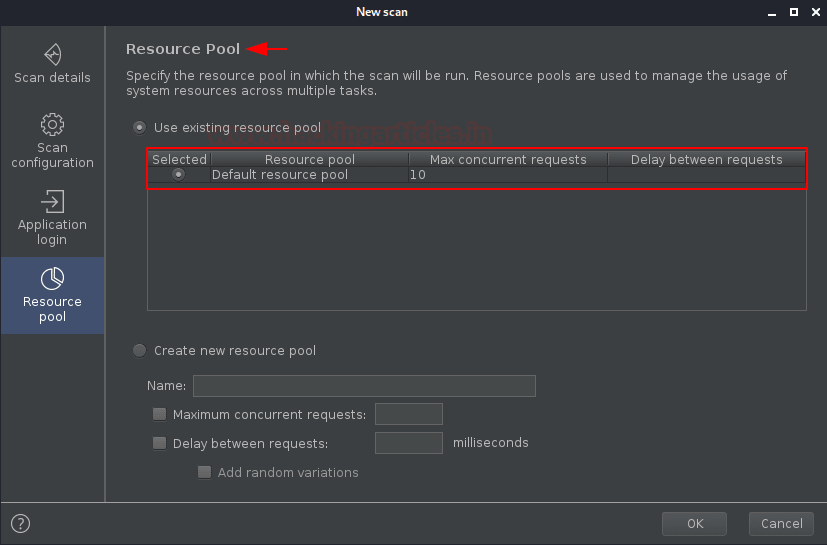
Along with all these things, we have one more option in the “New Scan Dashboard” which is “Resource Pool”.
A resource pool is basically a partition defined for concurrent requests, or in simpler terms, we can say how many requests the scanner will send to the application at one time and how much time will pass between two requests.
So if you’re testing a fragile app that might crash due to too many requests, you can set it accordingly, but since we’re testing a demo app, we’ll set them by default.
Now, when we click the OK button, our scanner starts, which can thus be monitored in the dashboard.
Now let’s wait for it to finish!! When we go to the Target tab, we will get a list of results, and there we can see that the registration page is not mentioned, which indicates that our configuration worked correctly.
Being more of a startup tool, burpsuite also acts as a vulnerability scanner. So it scans for apps named “Audit”. There are many vulnerability scanners on the web and burpsuite is one of them as it is designed to be used by security testers and to closely match the existing techniques and methodologies for manual and semi-automated web application penetration testing.
So, let’s dig into the vulnerable program “testphp.vulnweb” and see what major vulnerabilities it contains.
Since we’ve already scanned the application, it would be easier to test it, however, to run the scanner, all we need is the URL, whether we get it by making a request or via the target tab.
In the screenshot, you can see that we sent the base URL by right-clicking and selecting Scan.
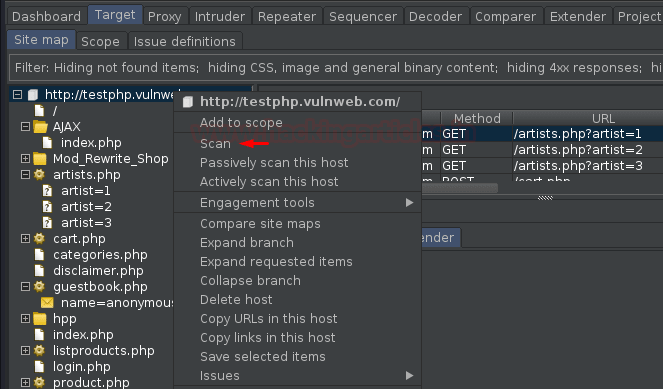
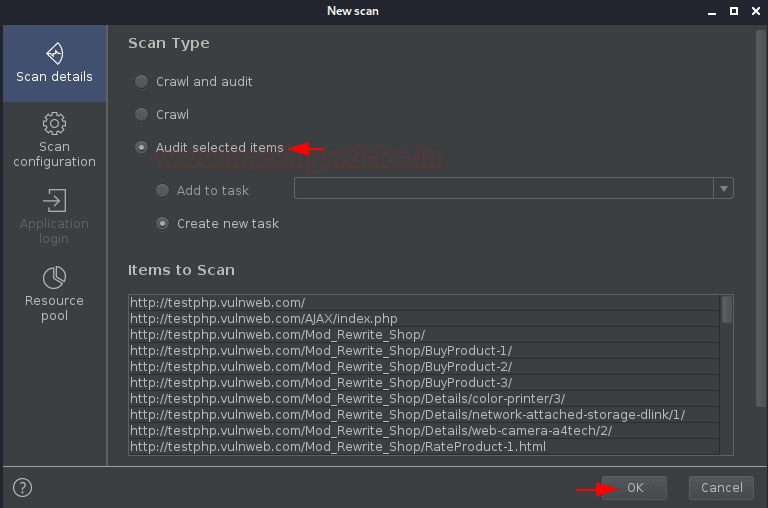
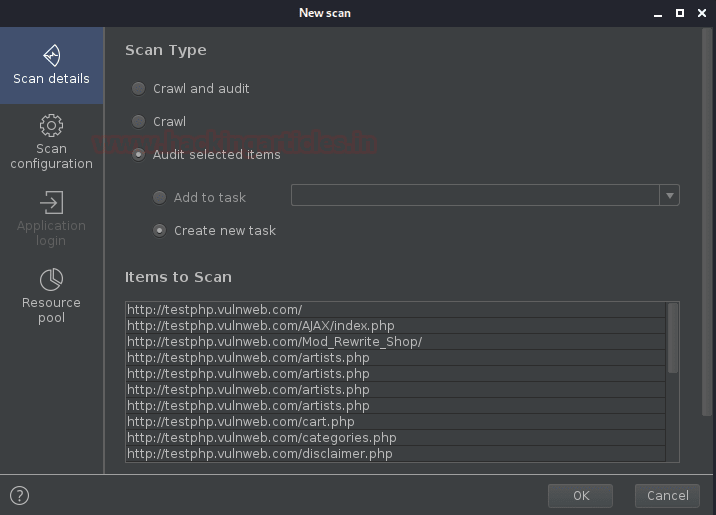
Once we do this, we will be redirected back to the new scan dashboard. But wait!! This time we have one more option i.e. “Audit Selected Items”. Once we select it, we’ll get all the URLs in the “Item to crawl” field (this is because we’ve selected the base query).
Since we’re dealing with the default audit, we’ll just click the OK button there.
Now you know where we need to go. So !! Dashboard tab. This time, not only the Tasks section and the Event Log have been changed, but we can also see variations in the Problem sections and Advisory sections.
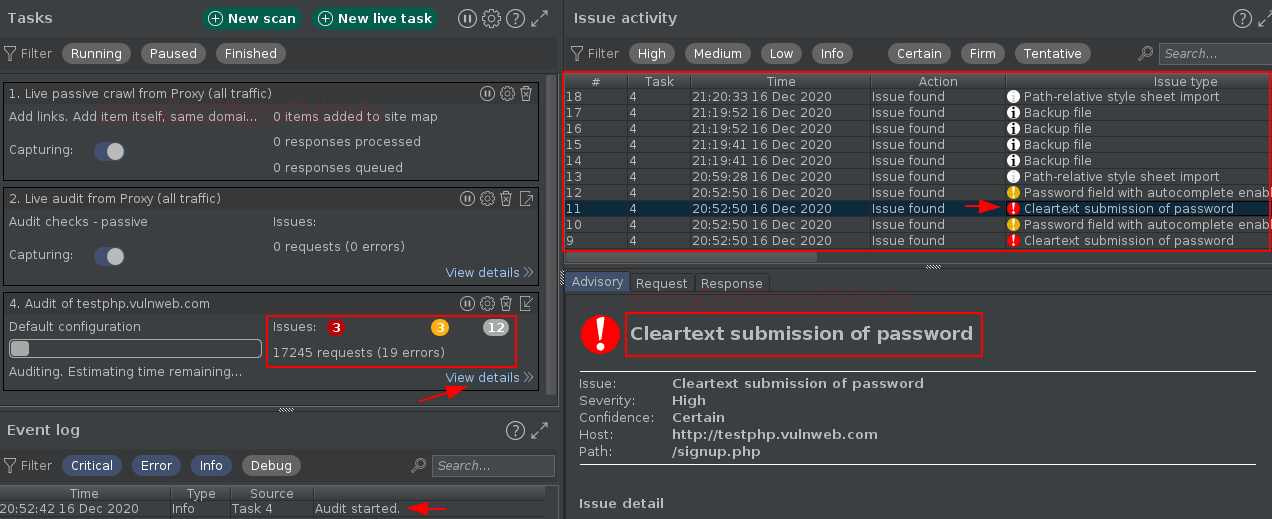
From the image above, we can see that within a few minutes, our scanner sent about 17,000 requests to the web application and even threw out a number of vulnerabilities according to the severity level.
To do this, simply click on the “View Details” section located at the bottom of the defined task, and thus you will be redirected to a new window with all the refined details in it.
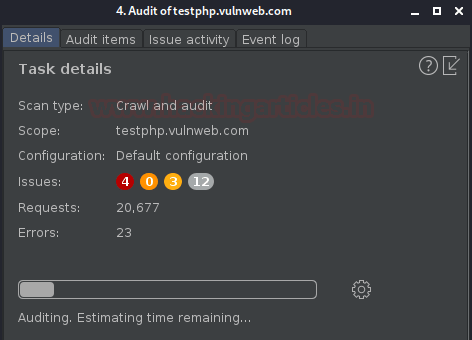
Cool!! Let’s check out the tested items. And when we go to the Audit Elements tab, we’ll go to the detailed version of the audited sections, where we’ll get statues, active and passive phases, URL requests, and more.
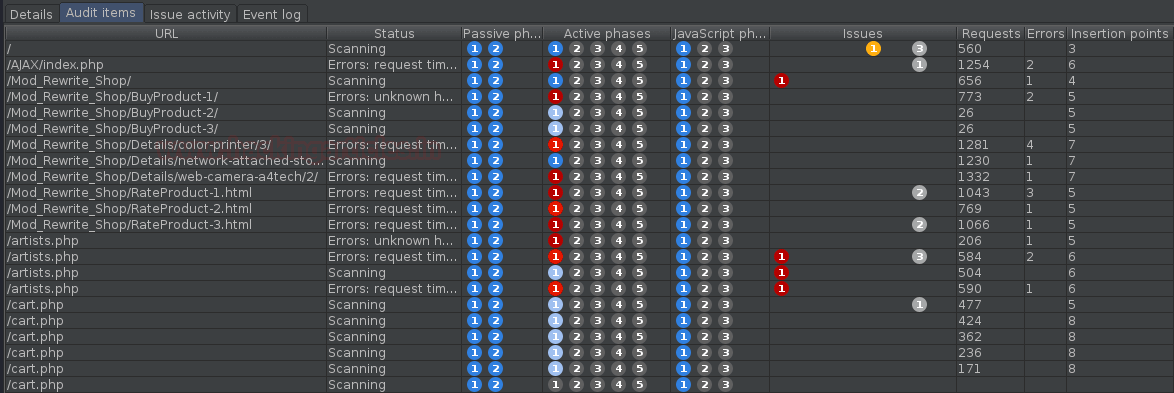
Additionally, we can even check detailed issues that have been found in the web application.
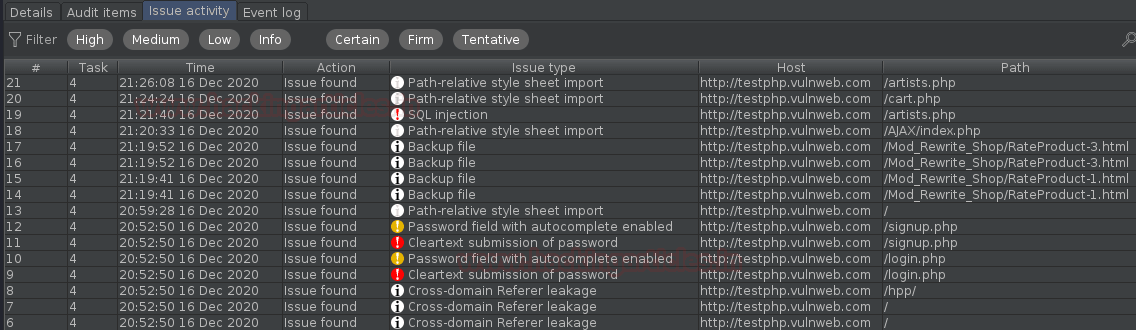
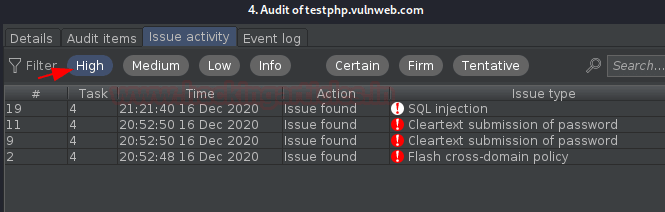
Although we can even filter them according to defined severity levels.
Not only these things, in the target tab there is something waiting for us, for example, problems and recommendations are also mentioned there, but if we look at the thrown tree in the left panel, we will see several colored dots, mostly red and gray, indicating that these URLs have high and informative existing vulnerabilities accordingly.
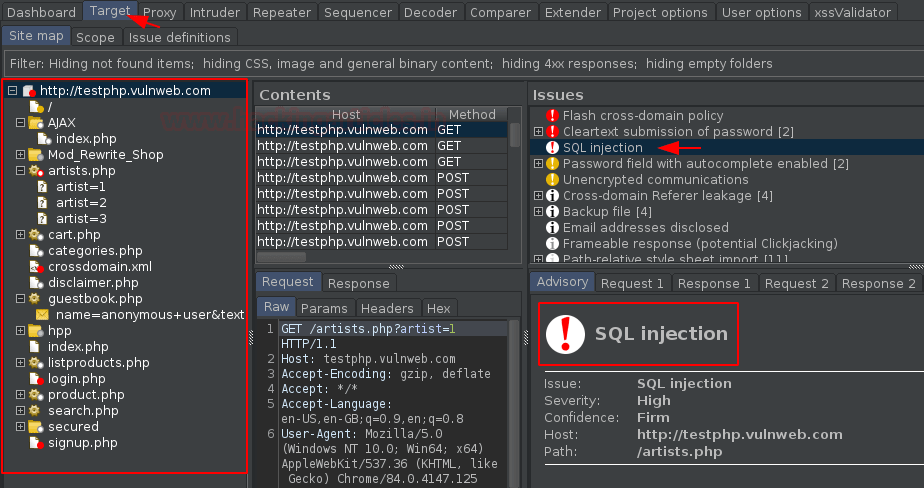
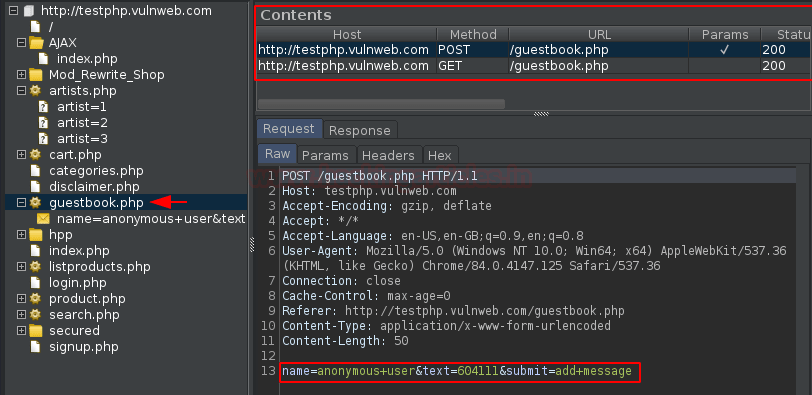
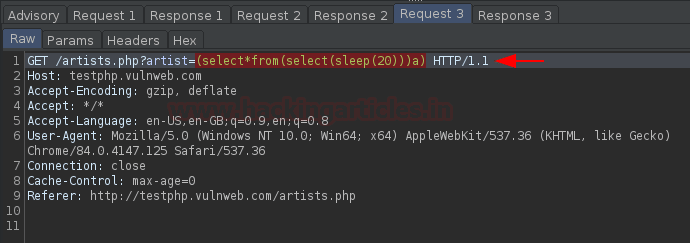
However, in the image below with the SQL injection advisory option, there is a separate panel for the request and the response, let’s check them and determine how the scanner confirms the presence of SQL injection.
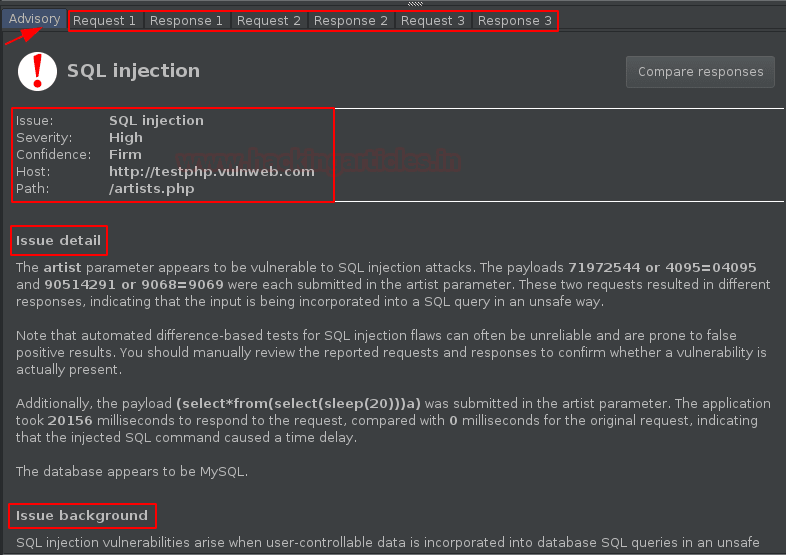
When we move to the 3rd query, we get a SQL query based on the time typed in the “artist=” field. And when we shared this request with the browser, we got a delay of about 20 seconds, which confirms that the vulnerabilities dropped by the scanner are active.
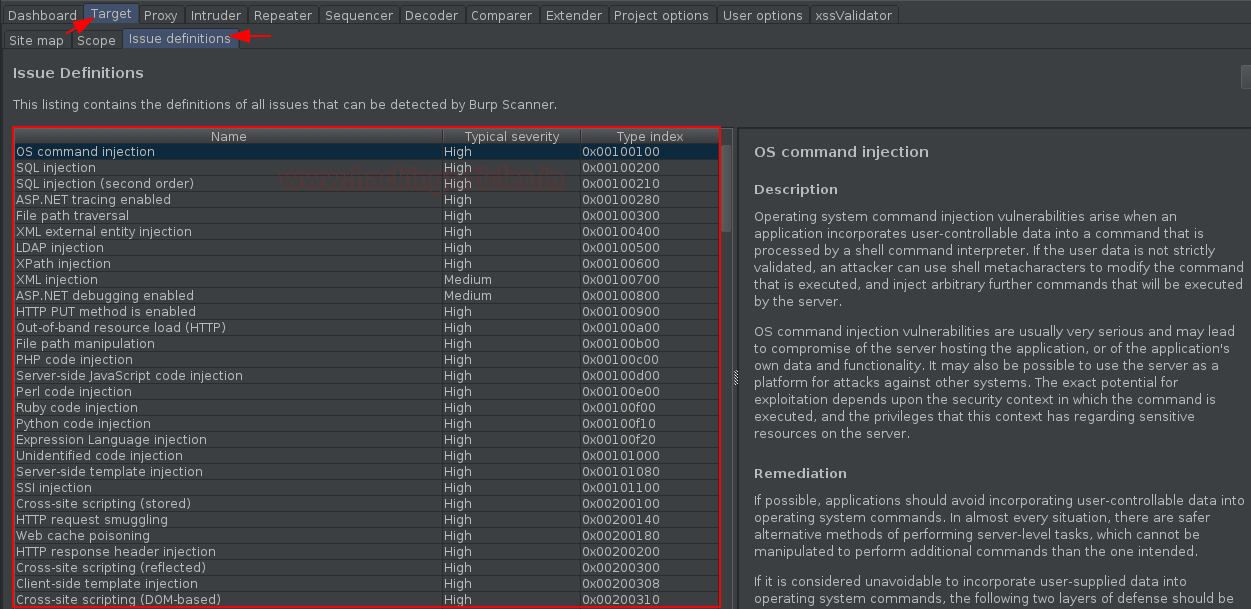
You might be thinking, ok, I have a vulnerability, but I don’t know about it – what else can I get or how can I tie it to a decisive blow. So to solve this problem we got a problem definition section where we can just go through the identified or discovered vulnerability.
Similar to the scan option, we can simply set up this audit by going back to the New Scan dashboard, right-clicking on the specified URL and clicking Scan.
Here in the above image, if we scroll down, we will get the same option to set the URL out of scope , as in the Scan section. Now, moving forward with the scan configurations, click the New button as we did earlier.
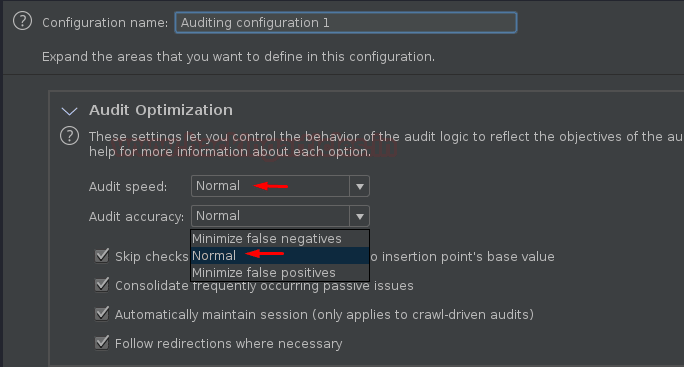
By setting the name of the default configuration and manipulating the audit precision to normal, you can define it according to your needs.
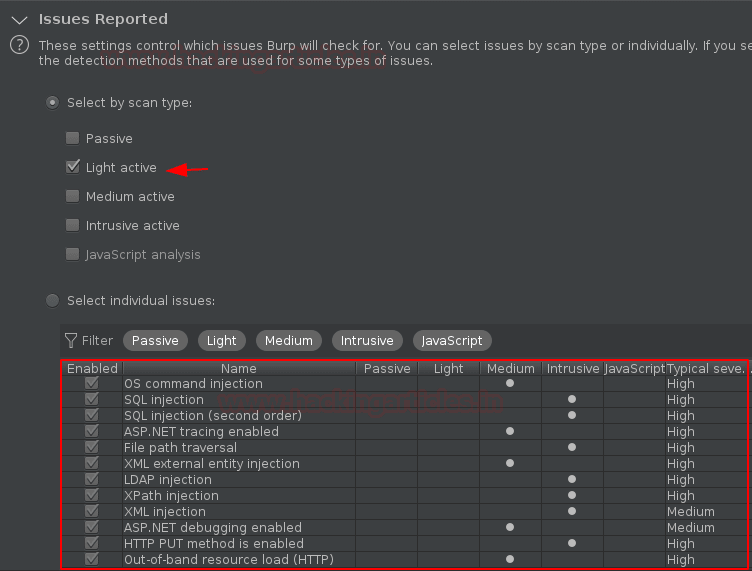
Now let’s move on to the most important section of identifying reported issues by selecting Scan Type. Here, to complete the scan faster, we simply select the Light active scan option, but you can choose any of the following:
Passive – These problems are detected simply by inspecting the application’s request and response behavior.
Lightly Active – Detects problems here by providing a small number of benign additional requests.
Medium activity refers to issues that can be detected by sending requests that the application may consider malicious.
Intrusive Activity – These issues are detected by sending requests that have a higher risk of damaging the application or its data. For example, SQL injection.
JavaScript parsing – These are issues that can be discovered by parsing the JavaScript that an application executes on the client side.
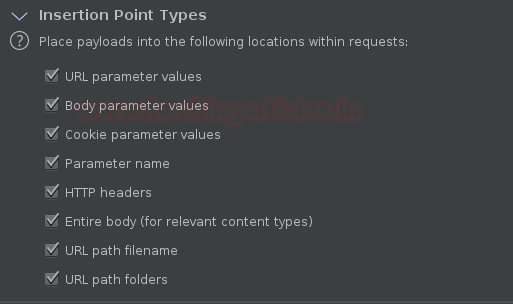
You may be aware of the concept of insertion points, as they are the most important sections for a vulnerability to hit. Basically, these are places in queries where useful data is entered. However, the belch scanner also checks for entry points and therefore can be manipulated in this phase as well.
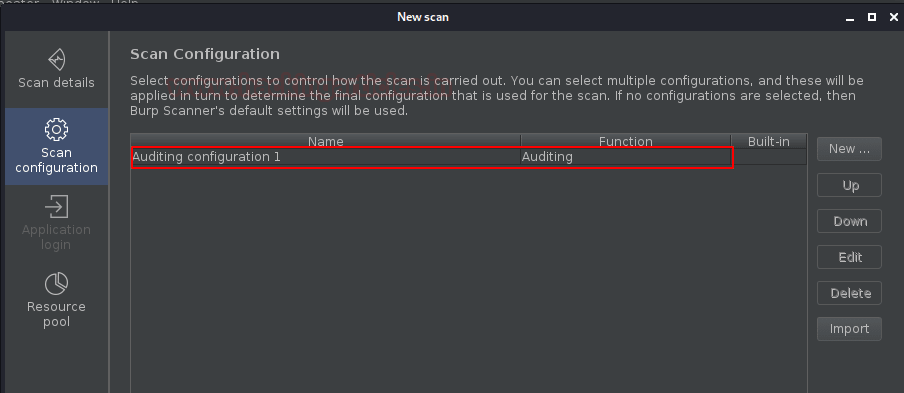
Now that we have completed the setup and clicked the Save button, our configured audit will be displayed in the New Scan dashboard.
However, in this section, the app login option is disabled because there is no particular need to log into the app just to check for vulnerabilities.
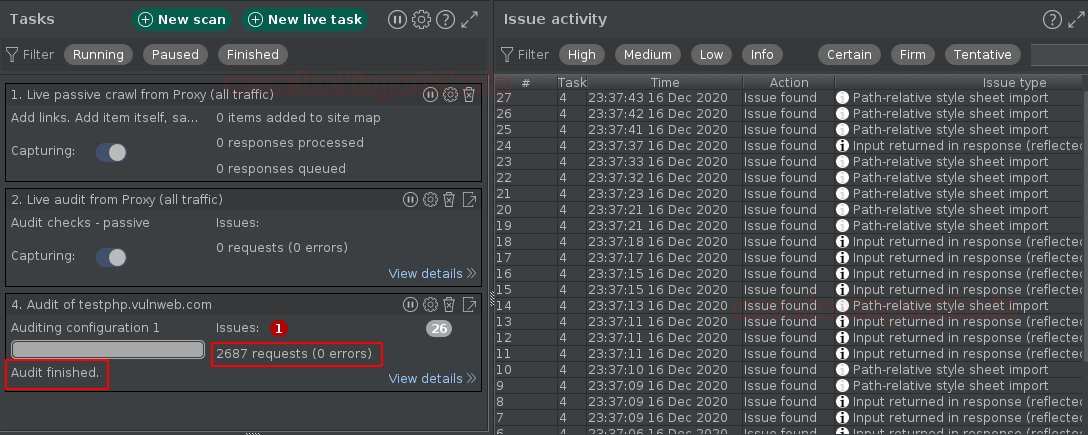
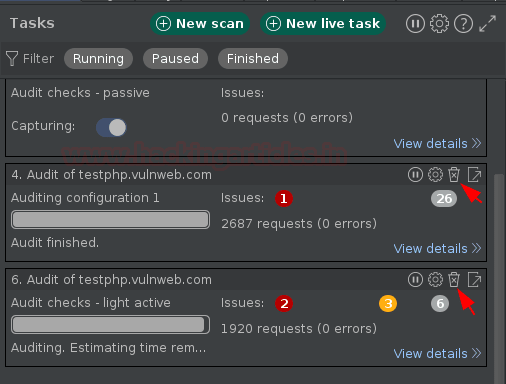
So, now we know what to do next, which is to click OK and go to the dashboard. And once we get there, we’ll get the result according to our configuration with about 2700 queries. But this time the main problem is only “1”
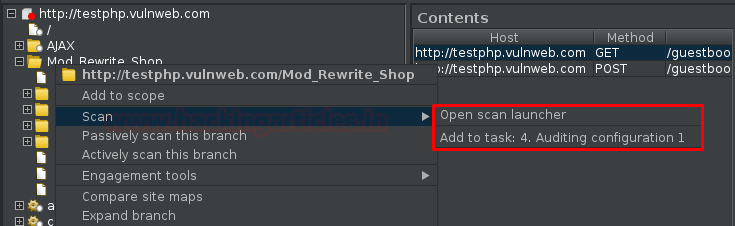
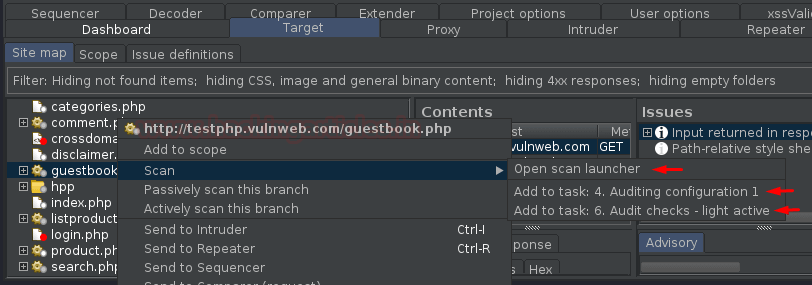
Now if we go back to the Target tab and select any query in the left panel and right click there, we get 2 options instead of 1, meaning the last setting we configured will go before this and if we will share any request in it, the corresponding audit will be started.
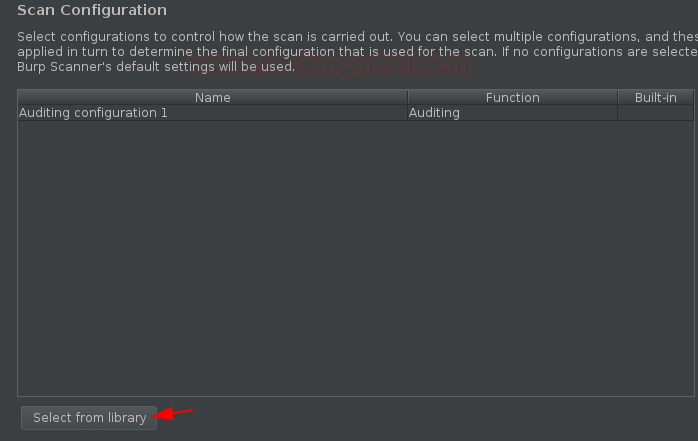
So, we’ll pick the open scan launcher again to test the other features as well. When we go back, we are greeted with our previous custom audit, but at the bottom there is a ‘Choose from Library’ option, click there and see what it has to offer.
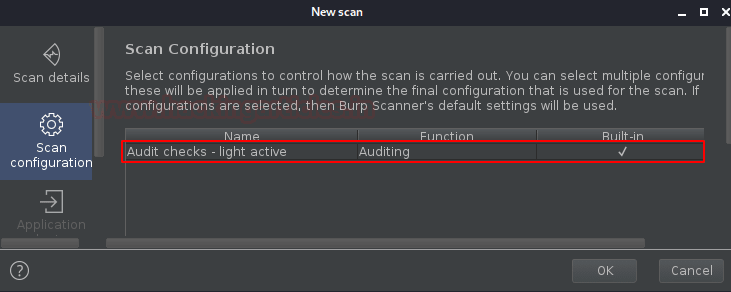
So, wasn’t it a bit confusing to set up the audit while manipulating each option?? So, to get rid of this, burpsuite offers another great feature to include a built-in audit check, where we just need to select any and proceed.
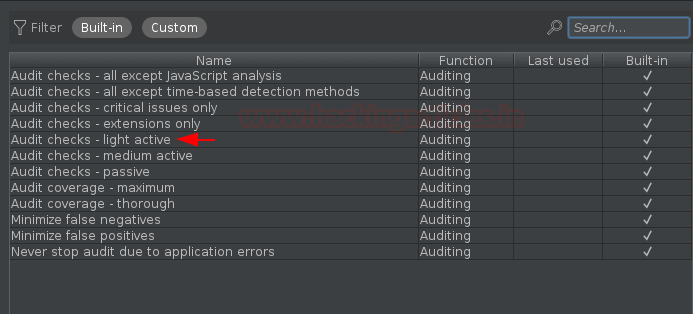
And when we select one, we return our option to the list in the New Scan dashboard.
Click OK and check the result on the dashboard !! Also, now if we go to the Target tab and right click on any query we get 3 options instead of 2.
So far we have been using scanner and scanner separately, but what if we want to do both things together. So, to solve this problem, the creators of burpsuite provide us with end-to-end scanning, where our burpsuite:
First, scan the app and find its content and features.
Next, it will start checking it for vulnerabilities.
So to do all of this, it all needs a “URL”. Let’s check how we can do this. Back in the dashboard, select New Scan and now this time select Scan and Validation, then mention the URL in it.
Perfectly!! Now let’s check the scan configuration options, when we go there and when we click on the New button, instead of redirecting us to the setup menu, it asks us where to go to optimize the scan or audit configuration. However, all internal parameters are the same.
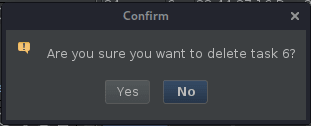
Rather than just knowing how to start or set things up, we also need to know how to complete it all. So, let’s click on the trash can icon defined as a task option to delete our completed or unfinished tasks.
And when we do, we get a confirmation popup.