
25.07.2024
2 min
1110

In the 2024 US election race, Kamala Harris and Donald Trump have been making heavy use of Facebook and Instagram ads. These candidates built their strategies by focusing on opponents, using iconic slogans and engaging alternative advertising platforms. The Harris campaign spent heavily on advertising through pages such as The Daily Scroll to reach a wider audience. Meanwhile, Trump has remained true to his legendary slogan “Make America Great Again”, consistently cementing his image.
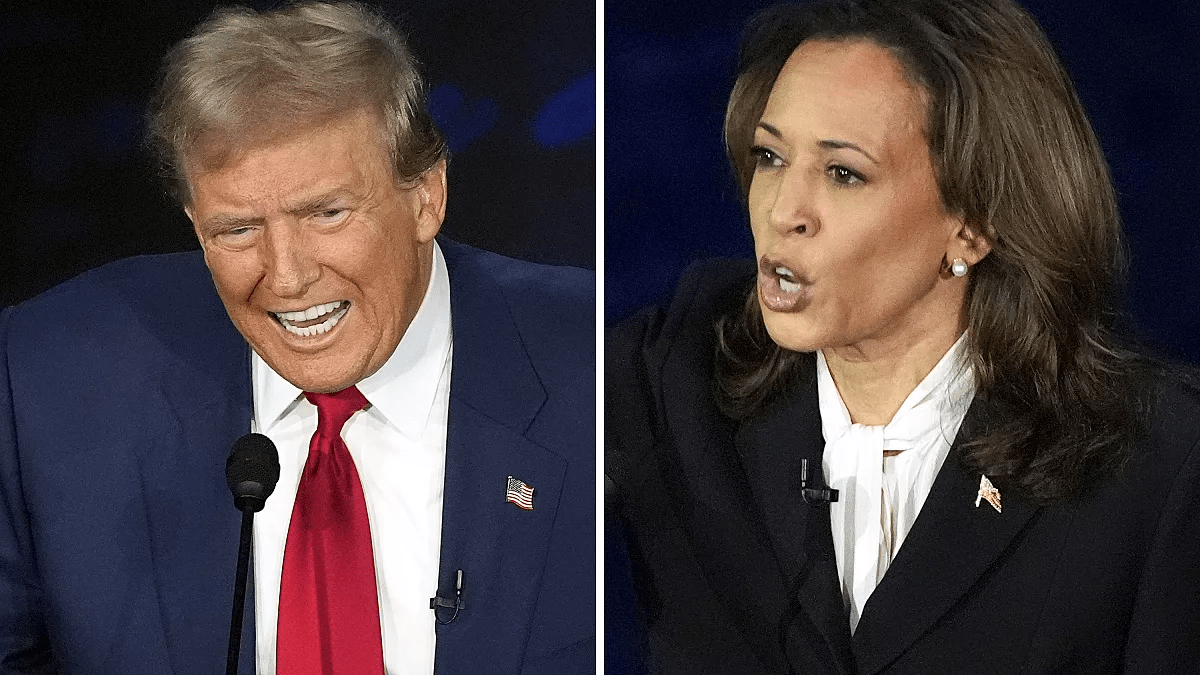
In the run-up to the November 5, 2024 US presidential election, Democratic candidate Kamala Harris’ campaign focused its Facebook and Instagram ads on frequent mentions of the phrase “Donald Trump,” while Harris’s name appeared much less frequently. Meanwhile, Trump’s team, the Republican candidate, continued to make heavy use of its iconic “Make America Great Again” slogan, first popularized during his 2016 election campaign.
This article explains how you can use the free tools available on Meta platforms to collect and analyze data on the political ad spend of both candidates on social media. This approach helps to understand how political leaders use digital strategies to reach audiences.
The analysis methods described here will be useful for evaluating advertising during other election campaigns and political events. Digital ad spend often reflects broader trends and strategies used in offline campaigns.
The data for analysis covers the period from July 21 to October 30, 2024 — from the moment Kamala Harris became the official candidate of the Democratic Party until the end of the active phase of the election campaign. This analysis provides insight into how both parties have used social platforms to influence voters.
In the Filters section, you can narrow your search results based on several parameters, such as the platform on which the ads were displayed, the date range they were displayed, and other variables.
For our analysis, we included all active and inactive ads that had impressions in the US between July 21 and October 30, 2024. At the same time, we did not apply filters based on language, platform, type of media content or audience size.
After obtaining the desired results, there is an option to export the data by clicking “Export CSV”. It is important to note that the Meta library has a limit – each Facebook account can upload no more than three such files per day.
For example, it was revealed that the Harris campaign directed $11 million to promote through third-party platforms, such as a little-known page called “The Daily Scroll.”
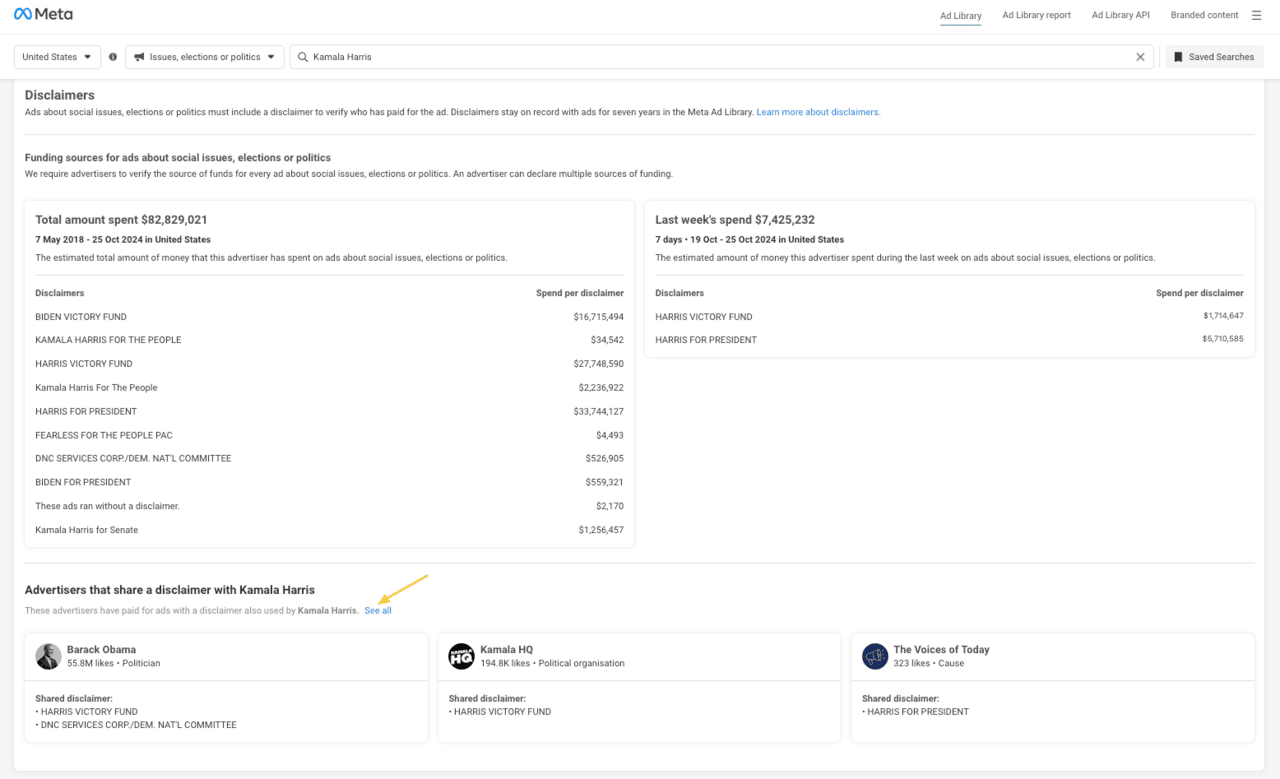
According to the platforms’ rules, all advertisements that deal with social issues, politics or elections must contain a clear disclaimer identifying the organization or person who paid for them to be posted. This allows tracking the sources of funding for political advertising and provides greater transparency.
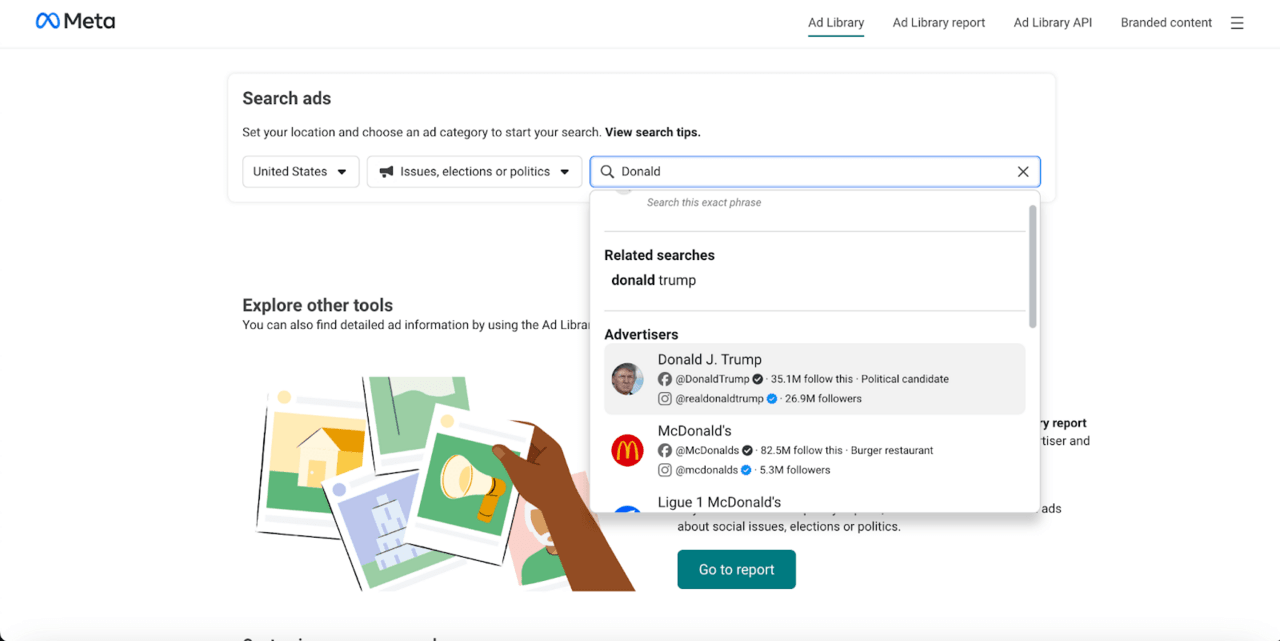
When analyzing advertising campaigns, you can use filters to search for ads by the names specified in the disclaimers (ie, advertising sponsors). This helps to find ads paid for by specific sponsors, but if you need to collect all ads related to one candidate, even through third-party pages, the task becomes more difficult.
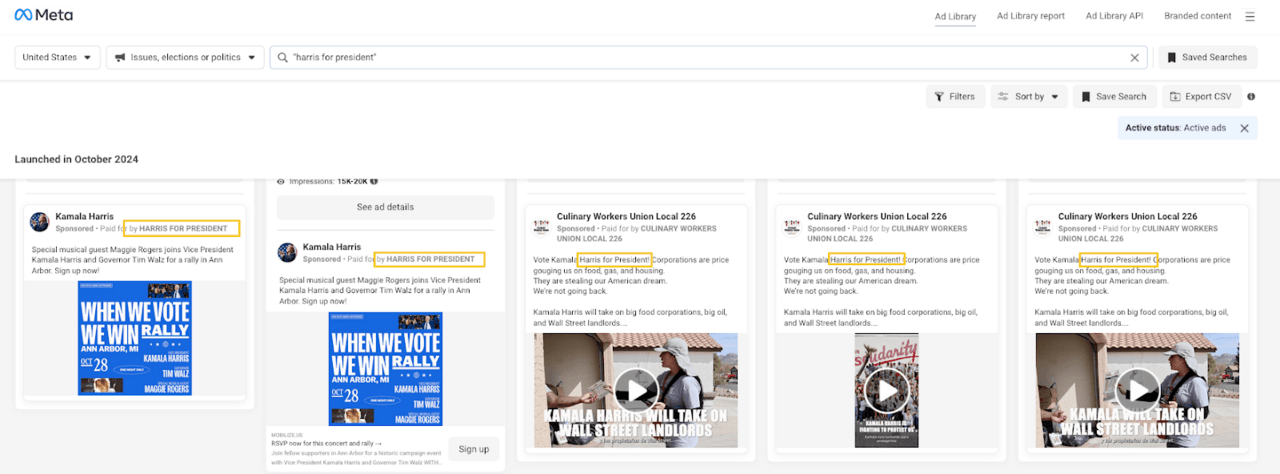
For example, Harris’ official campaign committee — “Harris For President” — may be listed as a sponsor in disclaimers for ads published on behalf of her official page. However, if you search for the keyword phrase “Harris For President,” the results may include not only ads paid for by this committee, but also ads that mention similar phrases, such as “Vote Kamala Harris for President!” even though they are sponsored by other organizations. This makes it difficult to accurately track all costs associated with a particular campaign and requires additional analysis.
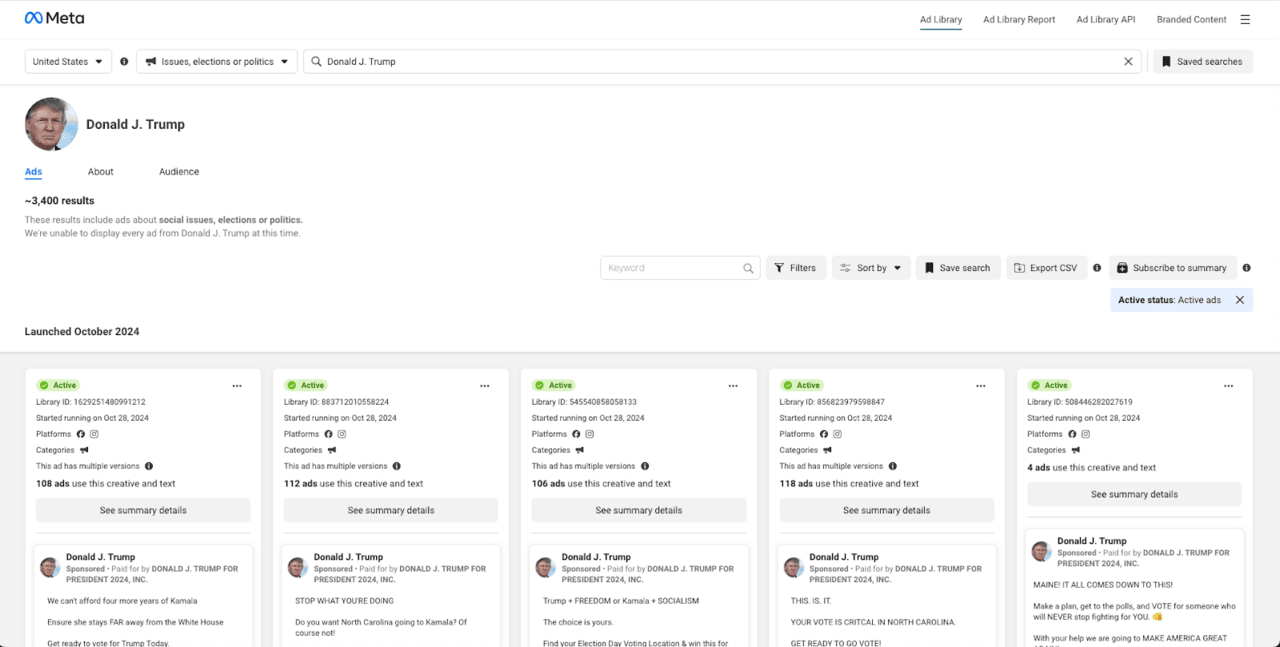
All ads published by pages that shared an advertising sponsor with the official pages of Kamala Harris and Donald Trump were collected for analysis.
To narrow the scope of the study to ads directly related to the candidates’ campaigns, those whose sponsors were not directly related to the official pages of Harris and Trump were removed.
It ended up identifying 17 different advertisers linked to Harris campaign ads and six advertisers who sponsored Trump’s official campaign ads. This approach makes it possible to assess the extent and strategies of using additional resources in the campaigns of each candidate.
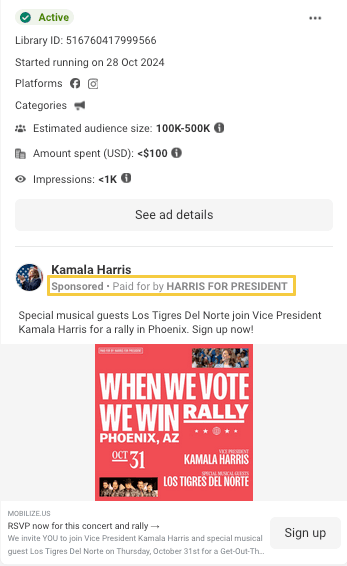
Downloaded files from the meta ad library contain important details about ad campaigns, including pages and platforms, ad creation dates, ad delivery regions, cost ranges, ad text, and associated links.
This data is presented in CSV format, which allows you to work with it in popular programs for working with electronic spreadsheets, such as Microsoft Excel or Google Sheets. However, for more complex data analysis and processing, it is much more efficient to use Python due to its simplicity and extensive set of data analysis tools.
For example, the “delivery_by_region” column contains information about the regions in which the ad was served as a percentage of the total number of impressions. In the case of US election data, these regions typically correspond to the 50 states. This information allows you to assess which regions the campaigns were targeting.
However, in the CSV files, the percentage data for each state is presented in a single cell, making it difficult to analyze and compare ad delivery between individual states. For ease of comparison and more detailed analysis, this data should be split into separate values using Python, which provides flexible opportunities for working with data arrays.
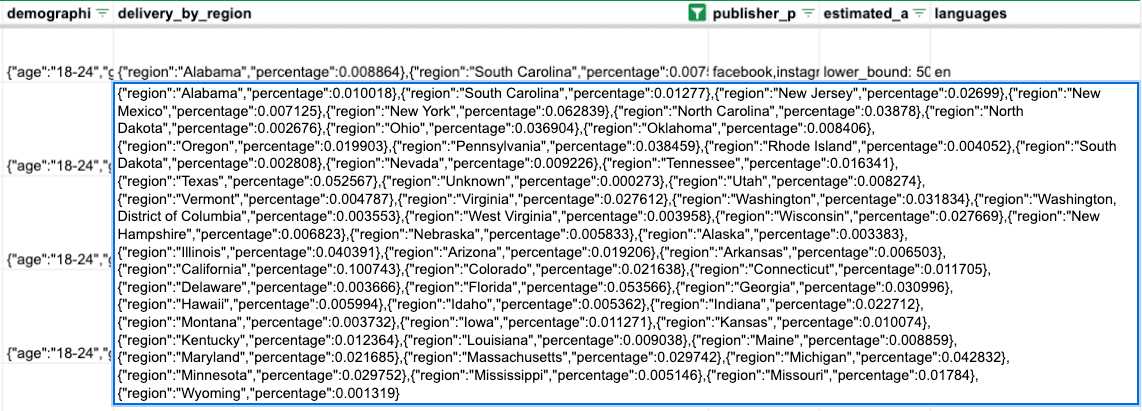
To analyze the data from the Meta library, Python was used to process the information. The rows of data about ad delivery regions were separated into separate columns for each state, which made it much easier to calculate the approximate cost of advertising in each state.
The demographics column, which contains information about ad targeting by age group and gender, was handled similarly. This made it possible to get a more detailed picture of advertising strategies.
Data from the Meta ad library provides cost ranges for each ad, which include a minimum (“lower limit”) and a maximum (“upper limit”) amount. The average value between these limits was used to estimate costs.
This approach made it possible to make approximate calculations of the costs of each campaign and to assess exactly how funds were distributed between regions and demographic groups, which reflects the priorities and strategies of political campaigns.
A calculation of average ad spending by candidate campaigns found that Kamala Harris’ campaign spent about $113 million on Facebook and Instagram ads between July 21 and October 30. This amount exceeds the GDP of some small countries. By comparison, Donald Trump’s campaign spent about $17 million over the same period.
However, these figures represent only a fraction of total advertising spend. In addition to spending on Meta platforms, the budget includes spending on TV advertising and advertising on other digital platforms such as Google.
Almost 99.8% of ads from the Harris campaign were placed simultaneously on Facebook and Instagram. For the Trump campaign, about 26% of ads ran exclusively on Facebook, and 7.5% were targeted on Instagram alone.
Digital ad spending is just one part of the bigger picture of campaign spending. More than $10 billion was spent during the 2024 election cycle, according to an analysis published by NPR on Nov. 1. This amount covers advertising for all levels of elections – from presidential to local races – and includes television, radio, satellite, cable and other digital platforms.
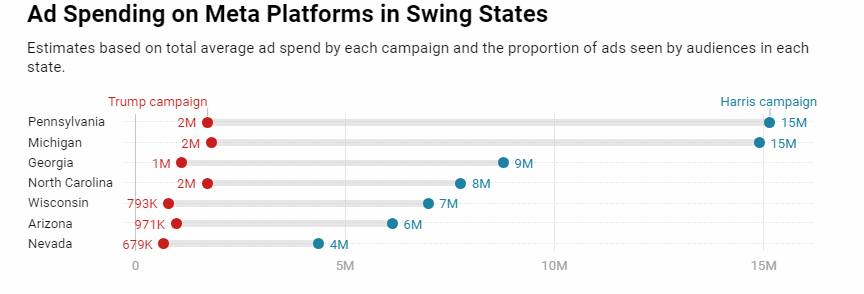
A proportional allocation method was used to estimate the cost of each advertising campaign on Meta platforms. The average cost of each ad was multiplied by the percentage of its impressions in each region (this data is obtained from the “delivery_by_region” column). This approach was based on the assumption that the cost of advertising is directly proportional to the distribution of the audience that viewed it.
The results of the analysis showed that the campaign of Kamala Harris directed a significant part of its expenses to the so-called “swing states” – regions that traditionally decide the outcome of the election. The largest spending was recorded in Pennsylvania, which election strategists call one of the most important states to win.
This approach allows for a clearer assessment of how campaigns used their advertising budgets to maximize the impact on target audiences in key regions.
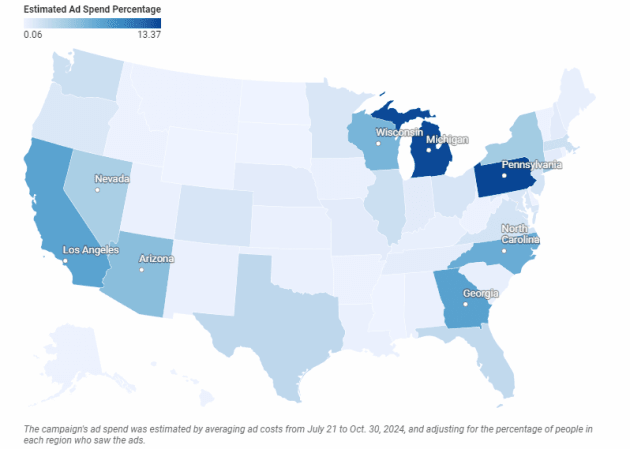
Pennsylvania played a decisive role in the 2020 election, with Biden winning by a narrow margin. The state supported Trump in the 2016 election.
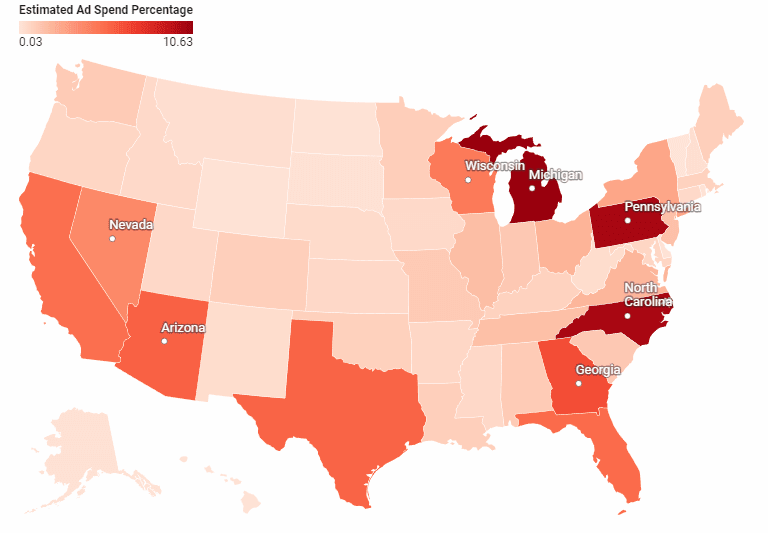
Seven states – Arizona, Georgia, Michigan, Nevada, North Carolina, Pennsylvania and Wisconsin – are considered key to the White House in 2024.Trump’s campaign also focused on swing states, but Democrats outperformed Republicans in each of those states.
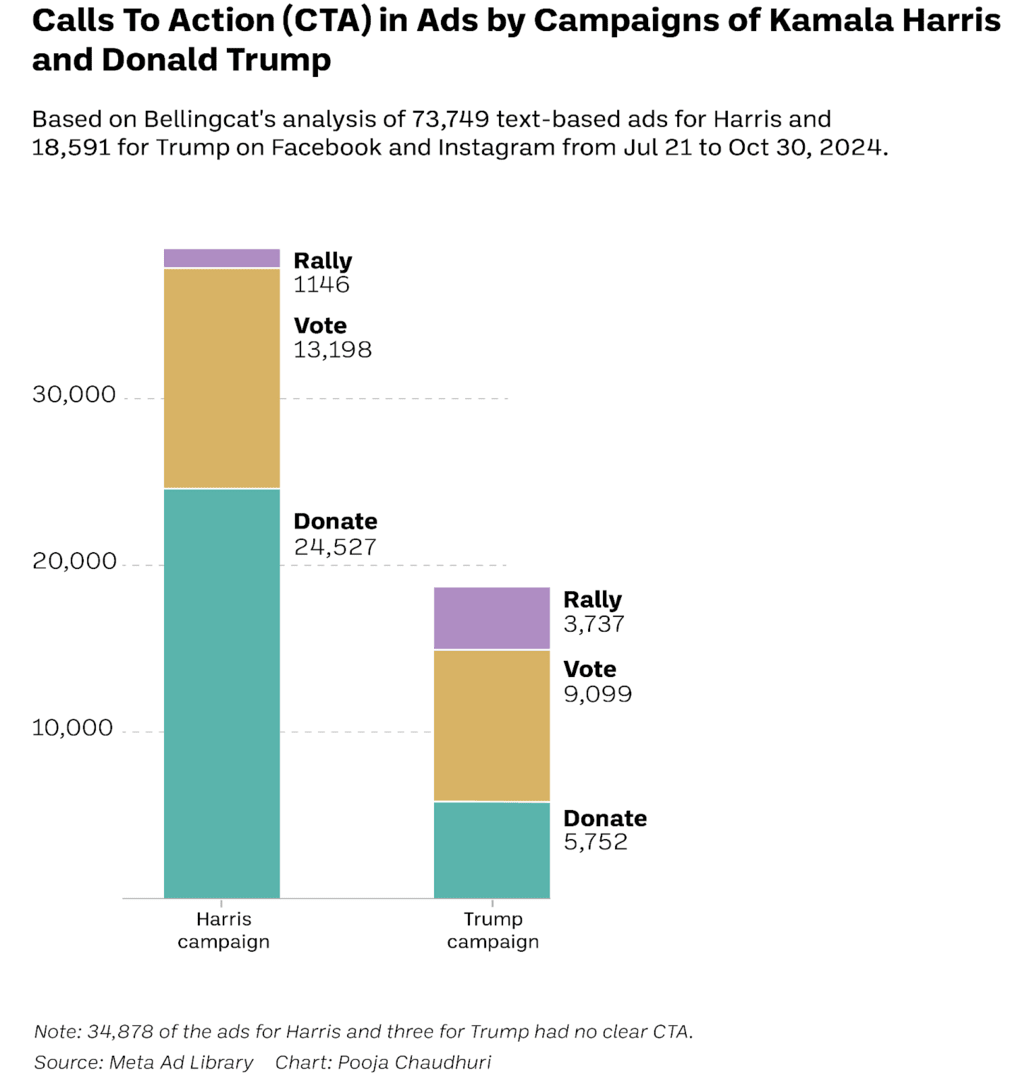
An analysis of the advertisements showed that most of them contained clear calls to action aimed at mobilizing voters, collecting donations, selling official products or getting people to participate in rallies.
To classify the ads, a Python function was developed that analyzed the text of the ad and the URLs associated with it. For example:
The ad, which contained a link to “vote.donaldjtrump.com”, was flagged as a call to vote.
Ads with the URL “secure.actblue.com” were classified as fundraising because it is the Democratic Party’s official platform for donations.
Similar URLs were used to mark ads promoting rallies or selling official products.
Keywords such as “vote” and “donate” were also searched in the text and link descriptions for additional classification.
Almost all ads were successfully classified.
Main categories: voting, donations, rallies.
About one in five ads promoted physical rallies.
Only three ads (criticizing Harris’ position on fracking) were left uncategorized because they did not contain an explicit call to action.
About half of the ads could not be classified due to their less specific content.
Much of the advertising promoted news stories covering various topics without a specific appeal.
Among those that managed to be classified, most were aimed at fundraising.
Advertisements calling for participation in rallies accounted for only 1.5% of the total number.
These results suggest that the Trump campaign was more focused in its appeals, while the Harris campaign favored a broader information strategy, with less emphasis on mobilizing through physical rallies.
To analyze the key themes in the advertisements placed on Facebook and Instagram, a special tool was used to highlight unique two-word phrases and count their frequency.
The focus is on two-word combinations that provide more context than single words, but are still easy to analyze. In the process, common words such as “the”, “a”, “in”, which occur frequently but do not carry significant information, were excluded. Also removed were timestamps such as “4:00 p.m.,” as they typically appeared in rally-related ads and did not provide meaningful details about the messages themselves.
This approach revealed that the most common two-word phrase in campaign ads was the name of the opponent, which emphasizes the emphasis on criticism. The second most frequent was a phrase that referred to one’s own candidate, indicating attempts to strengthen recognition and support.
To analyze the main topics in advertising materials on Facebook and Instagram, the method of selecting two-word phrases and counting their frequency was used.
The analysis focused on two-word combinations, which provide more context than single words but remain easy to process. Common words such as “the”, “a”, “in” were excluded from the texts, as they do not add significance to the content. Also removed were time markers such as “4:00 p.m.,” which often appear in the context of rally announcements but do not reveal the essence of the advertising message.
This approach showed that the most common phrase in the ad messages was the opponent’s name, indicating the campaign’s emphasis on criticizing the opponent. The phrase associated with one’s own candidate, demonstrating efforts to promote his image and strengthen support, came in second place.
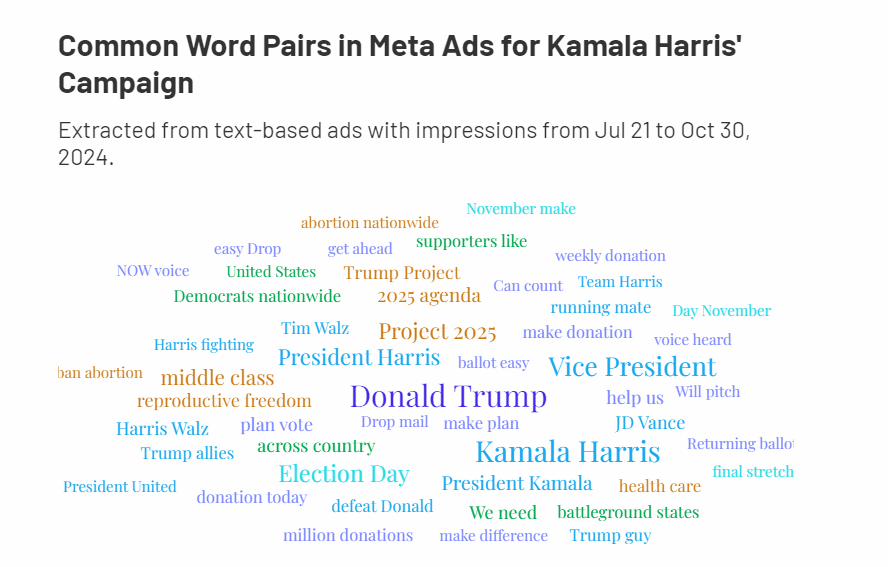
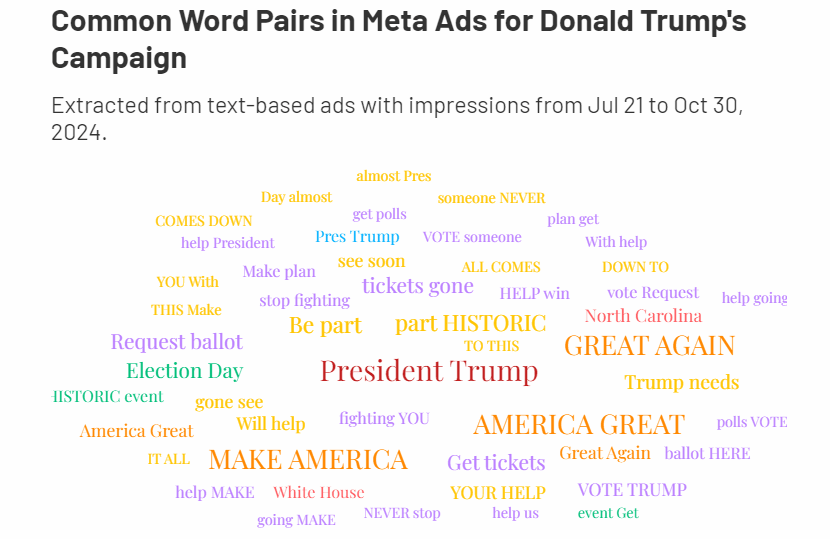
The analysis revealed a significant difference in the approaches to advertising strategies of both campaigns. Trump’s promotional materials have mostly focused on strong actionable appeals, such as “get on the ballot” or “get tickets,” while avoiding specific issues or political themes.
Instead, the Harris campaign heavily addressed social and economic issues, including discussing the themes of the “middle class” and “reproductive freedom” in much of its advertising. This approach shows the Democratic Party’s emphasis on meaningful messages that appeal to specific public interests.
The meta-ad library is a valuable tool for monitoring the electoral process by analyzing the ads that candidates place on Facebook and Instagram.
The analysis focused on ads published by the official campaigns of Trump and Harris. However, other sources of advertising, such as political action committees (PACs) or organizations supporting Democrats and Republicans, are worth considering because they can also have a significant influence on voters.
Advertising campaigns on Meta platforms are only part of a broader strategy that includes phone calls, text messages, campaign visits, billboards, flyers and advertising on other digital platforms. Combined with other data sources, such as the Google Advertising Transparency Center, a more complete picture of the scope and methods of influence being used in the run-up to the November 5 election can be obtained.