
11.02.2025
7 min
1143

The Process Memory Map utility shows exactly how programs use memory in Windows. It displays the process structure, thread stack, system areas like PEB and TEB, imports, modules, and even disassembled code. With its help, you can detect hidden changes, find function interceptions, and see how the program behaves inside the system. In this article, you will learn how this utility works, what opportunities it opens up for process analysis, and why Process Memory Map is considered one of the most convenient tools for reverse engineers and security researchers.

Modern systems work with a huge number of processes that constantly interact with each other, load modules, allocate memory and change their state. Understanding what is happening inside each process is not an easy task even for experienced developers or information security specialists. That is why the Process Memory Map utility was created – a tool that allows you to see in detail the complete memory map of a process in Windows, including all threads, structures, libraries and changes in real time.
It combines the depth of analysis that was previously only possible with the help of complex debuggers with the simplicity of visual display, which makes it useful for both security researchers and software developers. With support for a disassembler, import and export analysis, interception verification and control of memory changes, this utility helps you quickly find suspicious sections of code, track process behavior or investigate the operation of your own software at a low level.
Below is a detailed description of the capabilities, structure, and operating principles of the Process Memory Map utility.
process heap;
thread data such as: stack, TEB, SEH frames and CallStack;
information about loaded PE files with a breakdown into sections, entry points into each loaded image, their structures;
data from PEB;
data from KUSER_SHARED_DATA;
built-in x86/x64 disassembler (based on DiStorm)

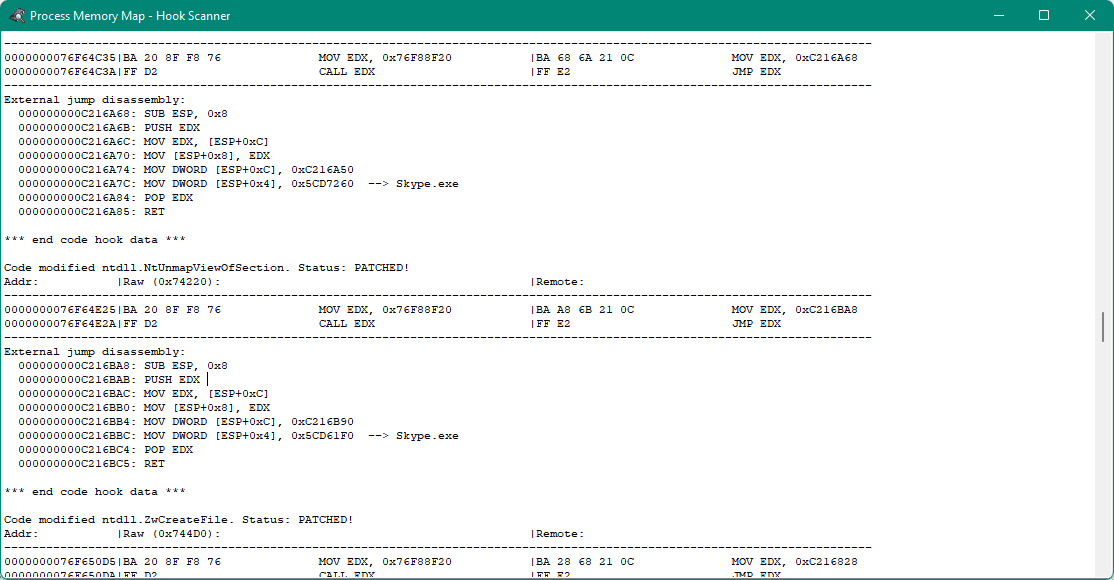
memory analysis for installed interceptors in import/export/delayed import tables;
analysis of installed interceptors in exported functions, entry points and TLS callbacks;
analysis of memory blocks based on their checksums (for example, reflecting changes in hacked software);
search in process memory.

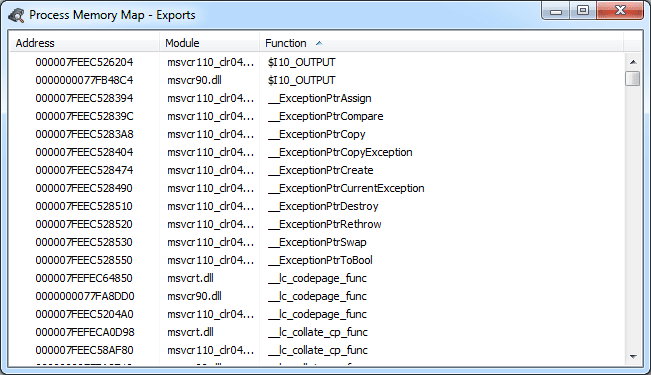
lists exported functions;
supports debug MAP files. (affects the list of recognized functions and the disassembler output);
displays changes in allocated memory blocks (alloc/realloc/free);
quick hint for known memory blocks.
For self-assembly you will need:
Virtual TreeView component package version 8.0 and higher is installed: https://github.com/JAM-Software/Virtual-TreeView
The compilation is performed using Delphi 10.4.2 Sydney in “Win32/Release” mode, and the 64-bit version of this utility will be automatically compiled and linked (as a resource). The performance of ProcessMemoryMap under older versions of Delphi has not been tested and is not guaranteed.
MemoryMap Core – 1.4.37
RawScanner Core – 1.1.25
FWZip – 2.0.6
Distorm – 3.5.3

1.5 full support for DWARF 4 and 5 versions, support for STUB types;
1.6 output of mapped information from the resources directory;
1.6 output of used resources as a tree;
1.7 output of mapped information from the exceptions, security directories;
1.7 output of mapped information from the com+ directory as a tree;
1.8 output of mapped information from the debug directory;
1.8 support for debugging PDB files;
1.8 translation of output of system structures based on data received from the PDB;
1.9 support for debugging information JclDebug (possibly as a plugin);
2.0 translation of Hex dumps and disassembler to FWHexView.
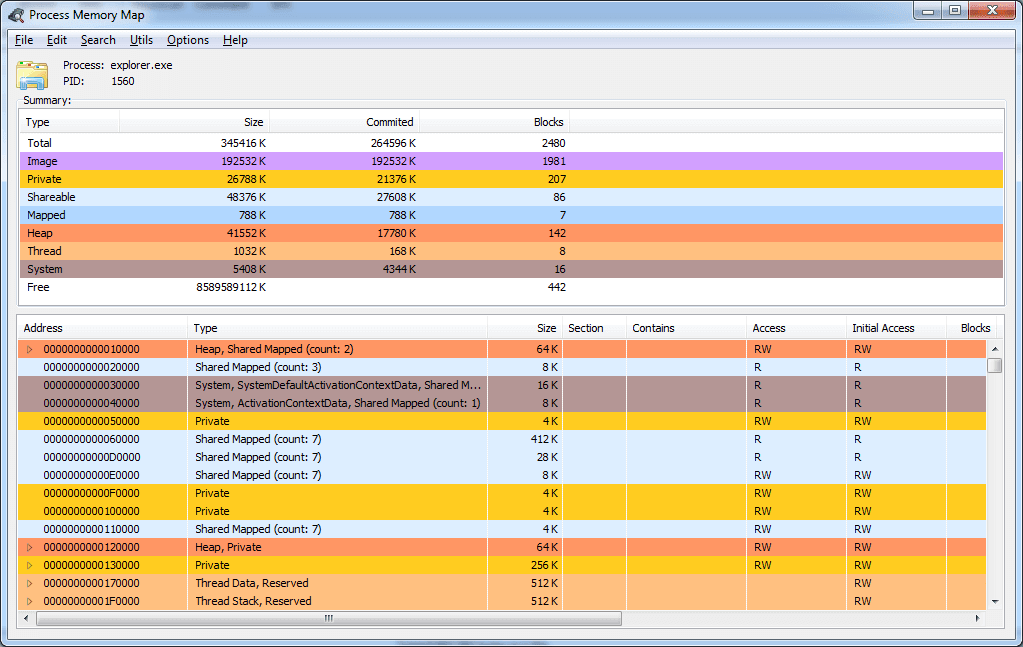
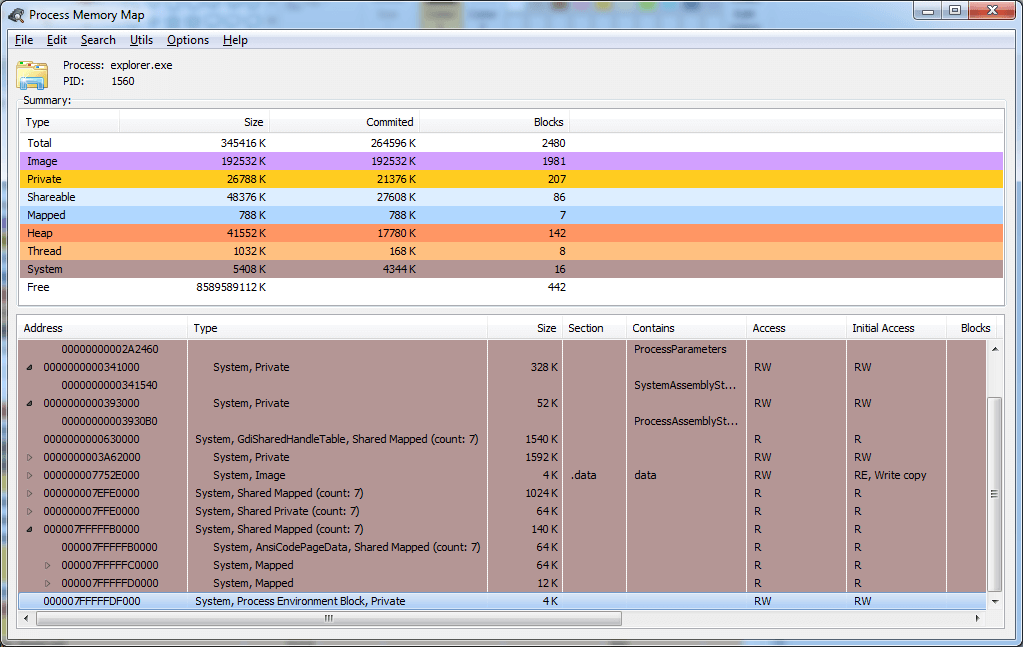
The Process Memory Map utility supports convenient filtering by data types, which allows you to quickly find the necessary memory areas. For example, you can display only those blocks that contain system structures such as KUSER_SHARED_DATA, PEB and other key elements responsible for the operation of the process. This greatly simplifies analysis and helps you focus on important areas of memory, avoiding unnecessary information.
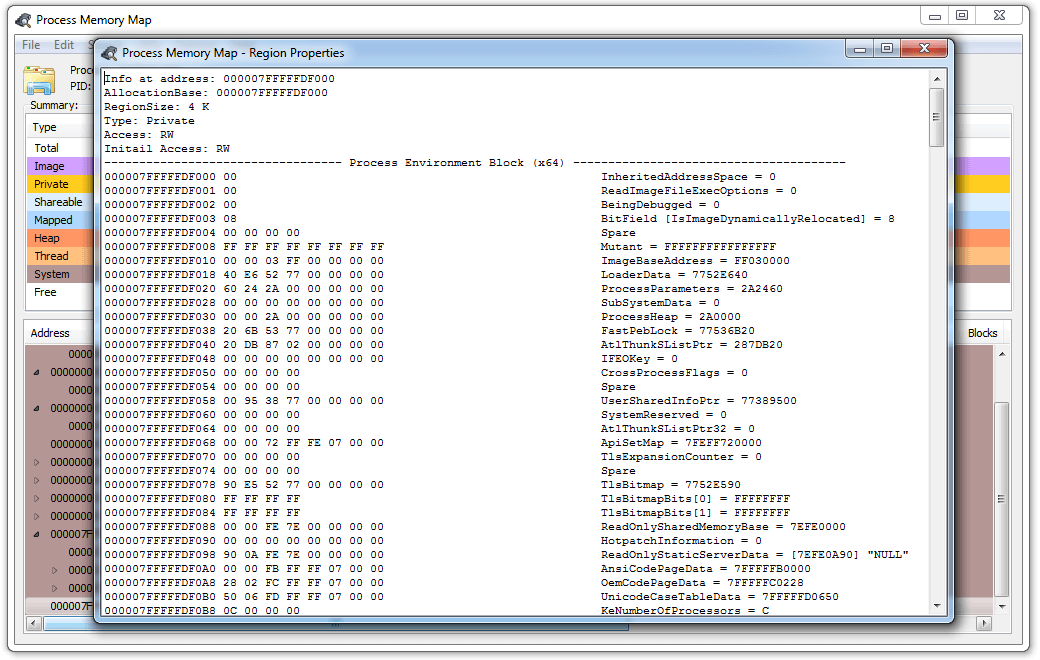
The data of all supported structures is mapped for their more convenient perception. For example, this is how the environment block of a 64-bit process looks like.
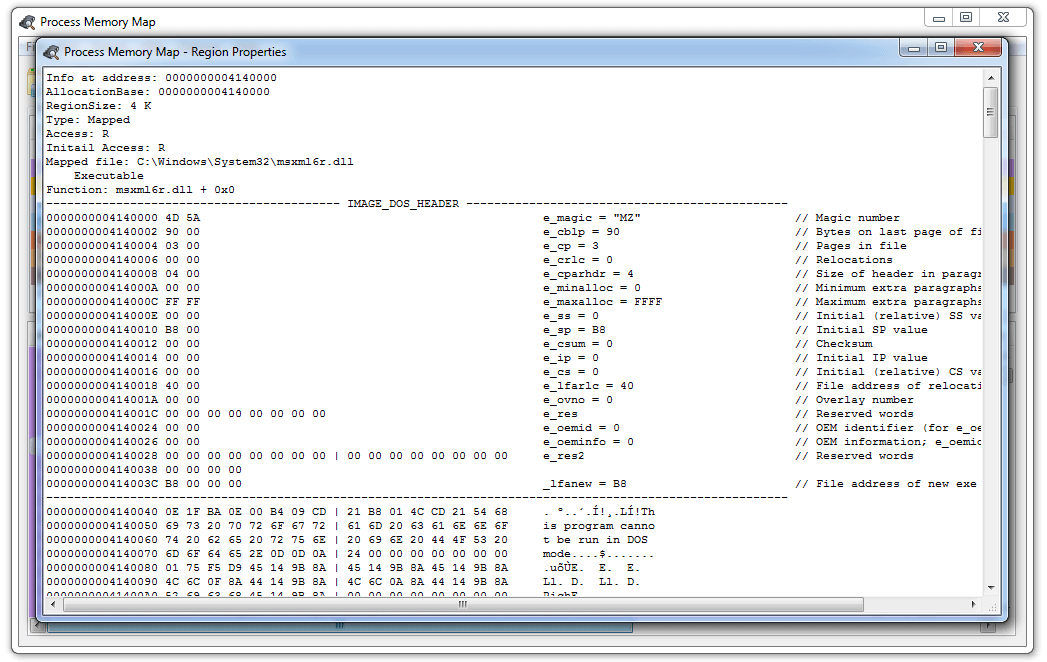
And this is what IMAGE_DOS_HEADER looks like
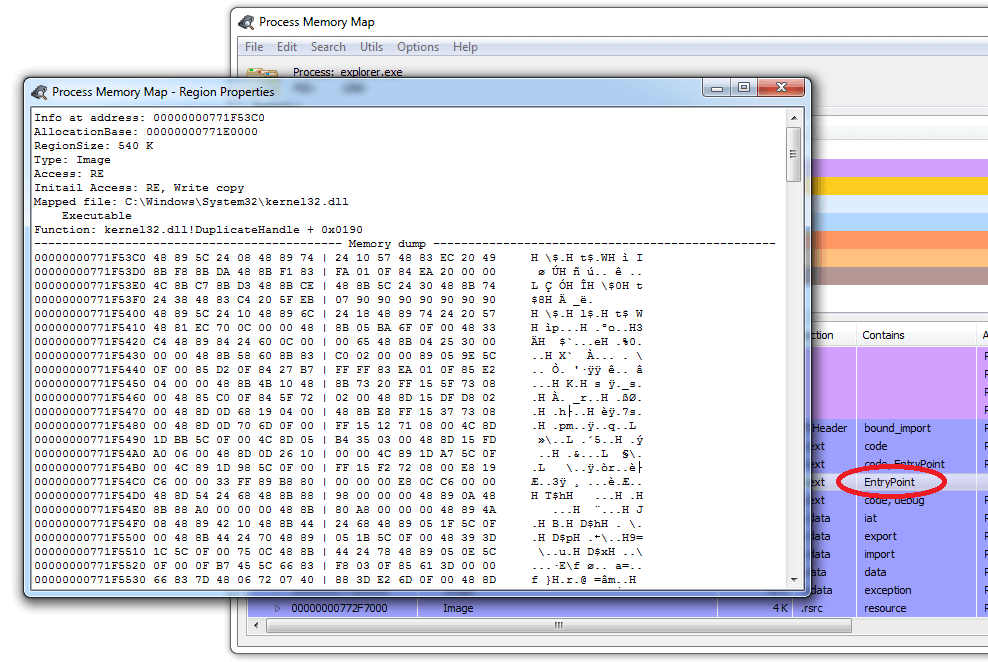
If it is not known what structure is mapped to the current memory address, the data is displayed in RAW mode. For example, here is the code at the kernel32.dll entry point:
It’s the same, but in the form of disassembled code (switch between views in the menu by right-clicking “Show as disassembly” or by pressing Ctrl+D):
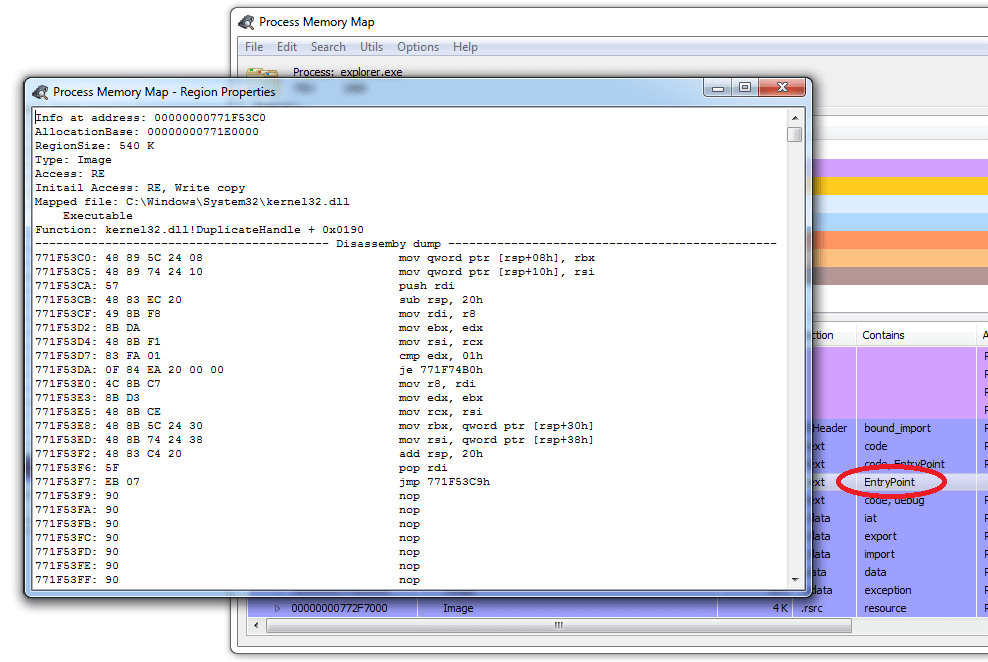
For clarity, the disassembler output is formatted.
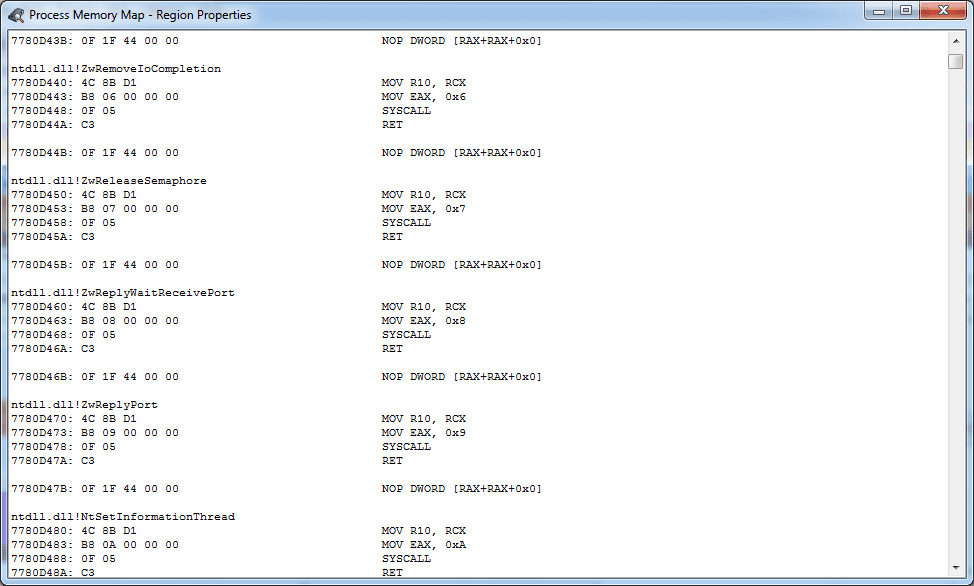
The code of known exported functions is preceded by a description.
The output is formatted to avoid eye-catching NOP and INT3 instructions, and the end of functions (RET/IRET/RETF) is highlighted.
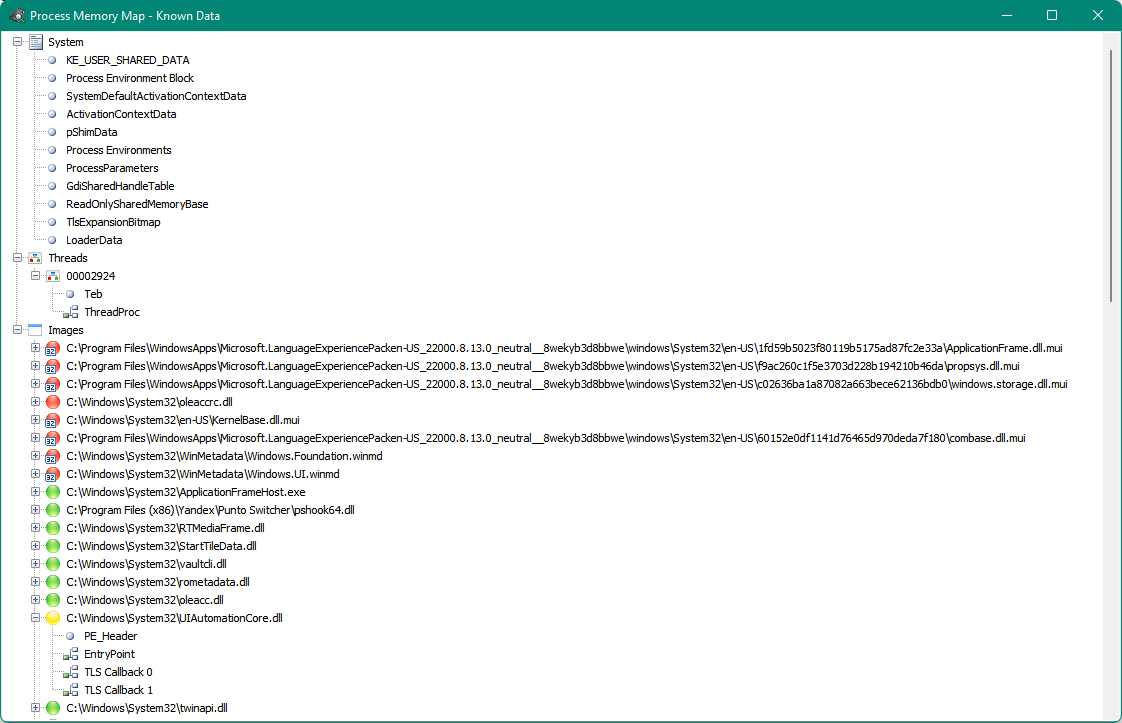
For quick navigation through known structures, a table of contents is provided, accessible via the View -> Show Known Data… menu or by pressing the F2 hotkey.
There is a list of all functions that are imported/exported (Ctrl+E). Data from the debugging MAP file is also added to it (if available – Delphi/C++ MAP files are supported). Search has been added to it both by address and by function name (search by library name is not performed)
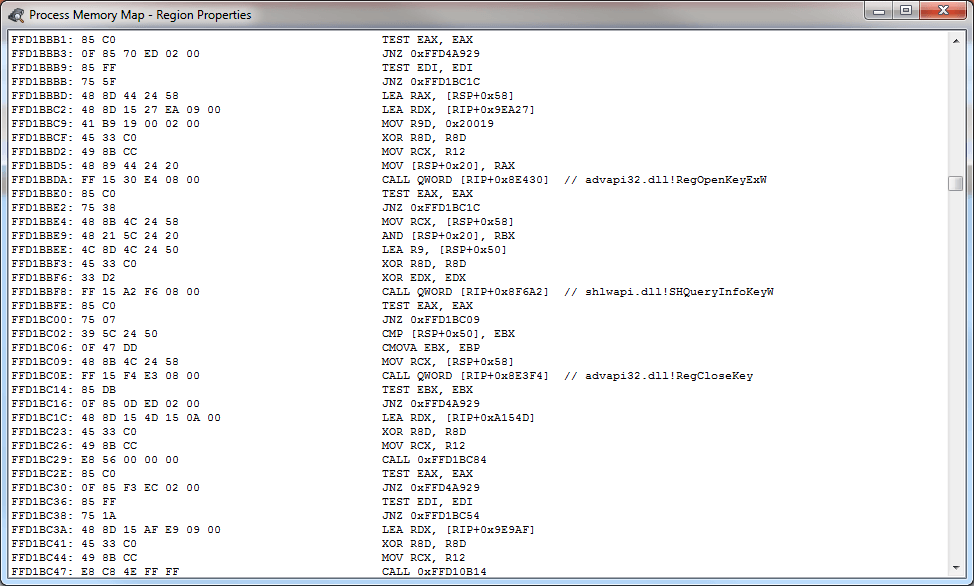
If information is available, known calls in the disassembler are commented out.
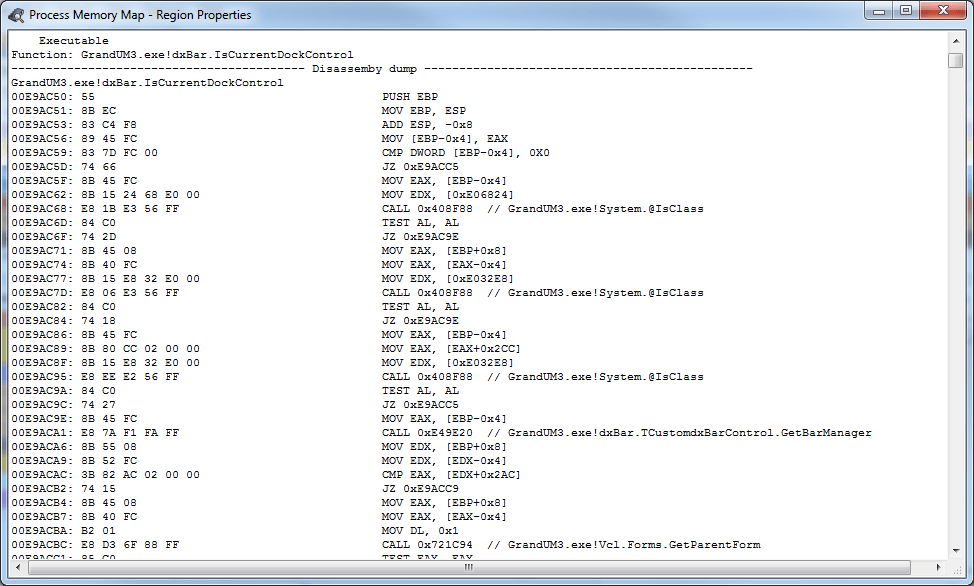
Including calls through the import table.
There is a process analysis module for installed function interceptors (F8)
There is a thread call stack demangling module, including 32 and 64 bits + 32SEH (F4)
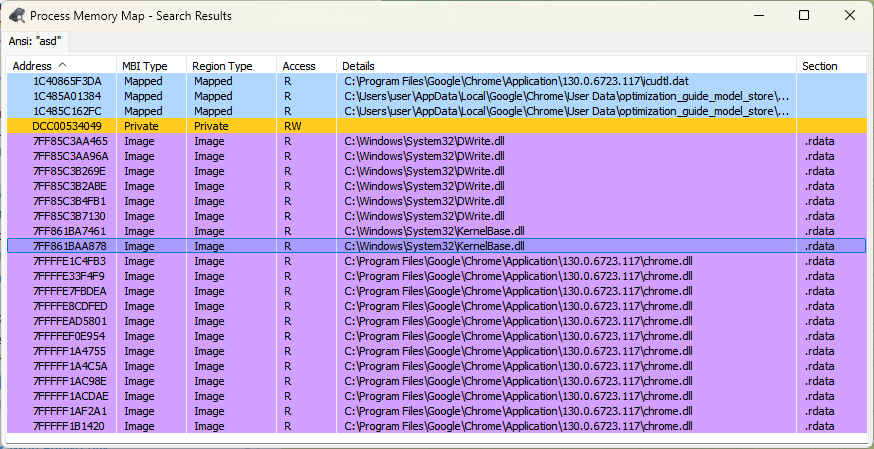
Search results are displayed in a separate dialog (Shift+F)
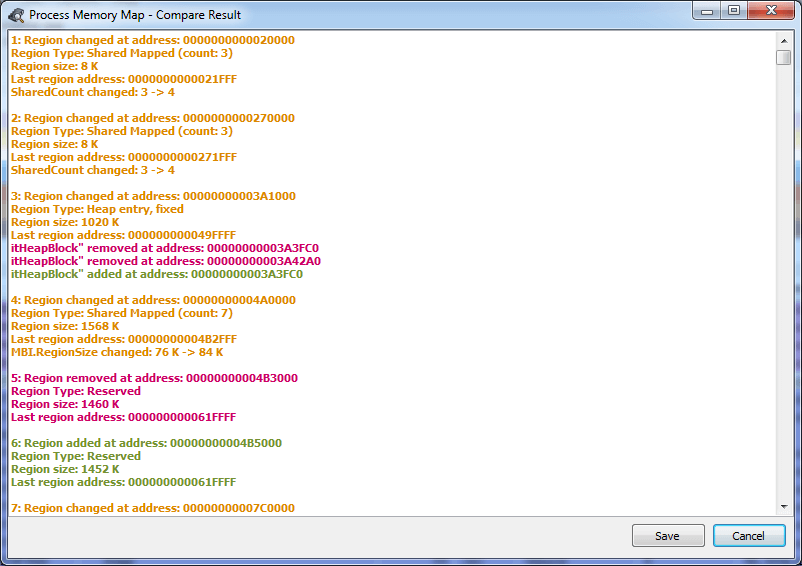
Well, this is what the list of changes in the selected blocks looks like since the last check (F5)
Process Memory Map is not just a memory analysis utility, but a full-fledged tool for exploring the internal architecture of Windows processes. It combines the accuracy of low-level analysis with the clarity of a graphical interface, allowing you to simultaneously see the memory structure, thread stack, loaded libraries, system areas, import and export of functions. With support for a disassembler, trap analysis, DWARF and MAP files, the program opens up the opportunity to deeply understand the behavior of any process in real time.
This utility will be useful for security researchers, reverse engineers, developers and debuggers who want to control what is happening “under the hood” of Windows. It helps to find traps, detect memory changes, check the stability of programs and understand the logic of code operation at the lowest level.
Process Memory Map is an example of how open source tools can become professional solutions for memory analytics, reverse engineering, and debugging. The project is actively developed, receives updates, and remains one of the most interesting tools for those working with internal Windows processes.