
02.10.2023
22 min
2490

If you know the protocols that directly interact with the electronic components of the system, you can penetrate IoT devices at the physical level. The Universal Asynchronous Transceiver (UART) is one of the simplest protocols to investigate, and using it is one of the easiest ways to expose IoT devices. Vendors usually use it for debugging and hence you can root through it. You will need some specialized hardware tools to do this; For example, attackers often identify the UART pins on a device’s PCB with a multimeter or logic analyzer, then connect a USB-to-UART adapter to the pins and open a serial debugging console from the attacking workstation. In most cases, when you do this, you will end up on the root sheath.

The Joint Test Action Group (JTAG) is an industry standard (defined in IEEE 1491.1) for debugging and testing increasingly complex printed circuit boards. JTAG interfaces on embedded devices allow us to read and write memory contents, including a dump of the entire firmware, giving us the ability to gain full control over the target device. Serial Wire Debug (SWD) is a very similar, even simpler, electrical interface than JTAG that we will cover here. Most of this chapter is a hands-on exercise: you’ll program, debug, and trick the microcontroller to bypass the authentication process using the UART and SWD. But first, we’ll explain the inner workings of these protocols and show you how to define UART and JTAG thermostats on a PCB using hardware and software.
UART –it is a serial protocol, which means that it transfers data between components one bit at a time. On the other hand, parallel communication protocols transmit data through several channels simultaneously. Common serial protocols include RS-232, I2C, SPI, CAN, Ethernet, HDMI, PCI Express, and USB.
UART is simpler than many protocols you’ve probably come across. In order for communication to be synchronized, the UART transmitter and receiver must agree on a certain baud rate (bits per second). Figure 7.1 shows the UART packet format.
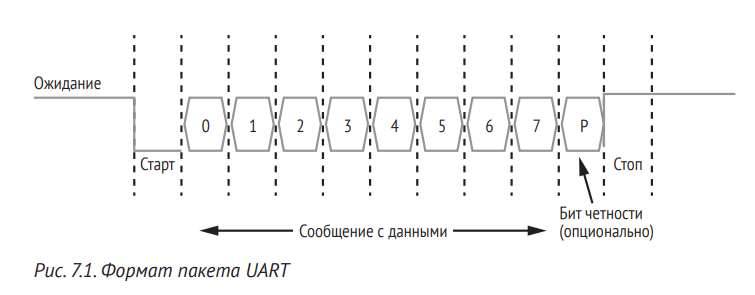
Normally, the line is held high (with a logic value of 1) while the UART is in the standby state. Then, to signal the start of data transmission, the transmitter sends a start bit to the receiver, during which the signal remains low (with a logic value of 0). Next, the transmitter sends five to eight data bits containing the actual message, followed by an optional parity bit and one or two stop bits (with a logical value of 1), depending on the configuration. The parity bit used for error checking is rare in practice. A stop bit or bits indicate the end of a transmission.
The most common configuration is called 8N1: eight data bits without parity and one stop bit. For example, if we want to send the character C or 0x43 in ASCII, in an 8N1 UART configuration, we must send the following bits: 0 (start bit); 0, 1, 0, 0, 0, 0, 0, 1, 1 (binary value 0x43) and 0 (stop bit).
A variety of hardware can be used to communicate with the UART. One simple option is a USB-to-Serial adapter similar to the one we use below in the “Jailbreaking a Device Using UART and SWD” section. Other options include the CP2102 or PL2303 chips. If you are new to hardware hacking, we recommend getting a multipurpose tool that supports protocols other than UART, such as Bus Pirate, Adafruit FT232H, Shikra, or Attify Badge.
A list of tools with their description and links to sites where they can be purchased is presented in the section “Tools for Hacking the Internet of Things” at the end of the book.
To connect to a device via UART, you first need to find its four pins, which are usually in the form of pins or pads (sometimes with covered holes). The term “thermoregulators” refers to the connection scheme of these contacts. We will use these terms interchangeably. The UART has four pins: TX (transmit), RX (receive), Vcc (supply voltage), and GND (ground). To begin with, open the case of the device and remove the printed circuit board. Please note that this may void your warranty.
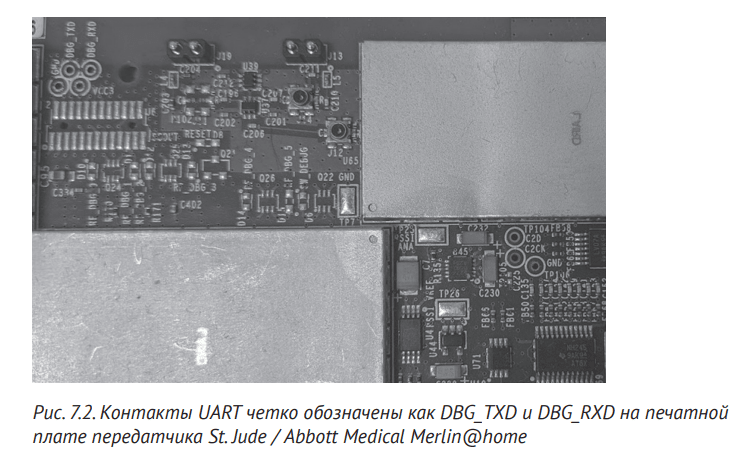
These four pins are often placed next to each other on the board. If you’re lucky, you may even find markings that identify the TX and RX ports, as shown in Figure 7.2. At the same time, you can be sure that the set of four contacts are UART contacts.
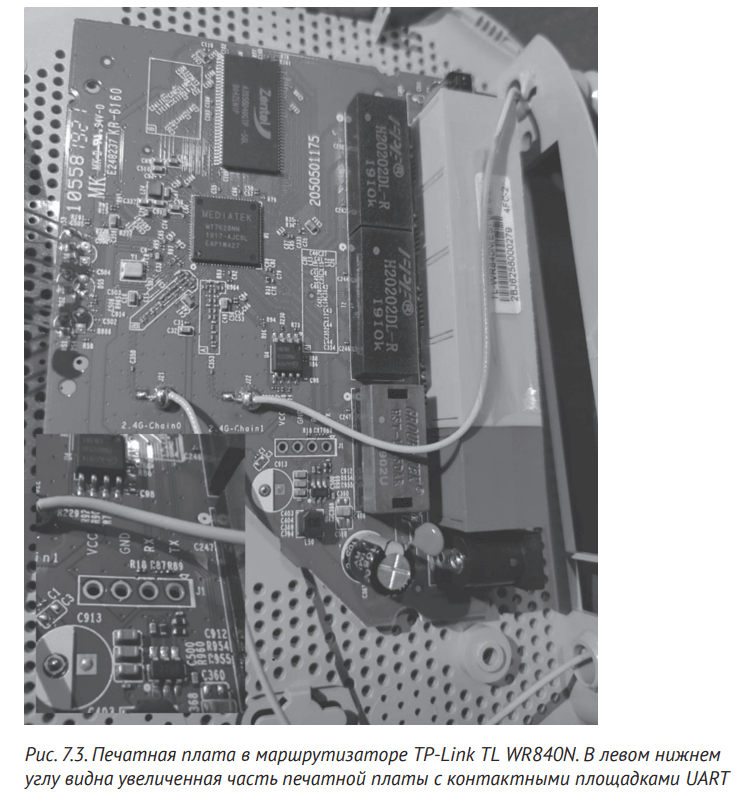
In other cases, you can see four pads with through holes next to each other, for example, in a TPLink router (Fig. 7.3). This may be due to vendors removing the UART connector pins from the PCB; Then you may have to either solder wires to them or use probes. (Probes are physical devices that connect electronic test equipment to a device, including a probe, cable, and term.
Also be aware that some devices emulate UART ports by programming general purpose input/output (GPIO) pins if there is not enough space on the board for dedicated hardware UART pins.
If the UART pins are not as clearly marked as shown here, there are usually two ways to identify them on the device: with a multimeter or a logic analyzer. A multimeter measures voltage, current and resistance. Having a multimeter in your arsenal when breaking equipment is very important, as it can serve a variety of purposes. For example, we usually use it to check the integrity of electrical circuits. During the integrity test, a beep sounds when the impedance of the circuit is low enough (less than a few ohms), indicating that there is an electrical connection between the two points measured by the multimeter contacts.
While a cheap multimeter can handle this task, we recommend getting a reliable and accurate one if you plan to delve deeper into hacking. True RMS multimeters measure alternating current more accurately. Figure 7.4 shows a typical multimeter.

Before determining the UART thermostats with a multimeter, make sure that the device is turned off. The black probe should be connected to the COM socket of the multimeter, and the red probe should be connected to the VΩ socket.
Let’s start by defining the “ground” pin of the UART. Return the multimeter scale to closed loop mode (usually represented by an audible vibration symbol). It can have a general switch position with one or more functions – usually a resistor. Touch the end of the black probe to any grounded metal surface (the area directly connected to the “ground” circuits), whether it’s part of the circuit board under test or something else.
Then move the red probe in turn to each of the board pins that you suspect may be part of the UART thermostats. If you hear the multimeter beep, the GND pin is found. Keep in mind that a device can have multiple GND pins, so the pin found is not necessarily part of the UART thermostat.
Now locate the Vcc power pin. Set the multimeter scale to constant voltage mode and set it to 20 V. Do not lift the black probe from the ground line. Touch the red probe to the intended power contact and turn on the device. If the multimeter reads 3.3 or 5V DC, you have found the Vcc pin. If the voltage is different, touch the red probe to the next pin, reboot the device and measure again. Test each pin until you determine Vcc.
Next, define the TX port. Leave the multimeter in DC mode with a voltage of no more than 20 V and continue to touch the ground with the black probe. Touch the red probe to the designated pad, then turn the device off and on again. If the voltage fluctuates for a few seconds and then stabilizes at Vcc (3.3 or 5), you’ve most likely found the TX port. This is because during boot the device sends serial data through this TX port for debugging. After the download is complete, the UART line goes into standby mode. Recall (Fig. 7.1) that the free UART line maintains a high logic level, which means that its voltage is equal to Vcc.
If you have already identified the rest of the UART ports, the closest fourth pin is most likely the RX port. Otherwise, you can identify it because it has the lowest voltage swing and lowest voltage level of all UART pins.
WARNING! It’s okay if you mix up the UART RX and TX ports, as the wires connecting to them can be easily swapped – there will be no consequences. But if you confuse Vcc with GND and connect the wires incorrectly, the device can fail.
For more accurate identification of UART contacts, a logic analyzer is used – a device that captures and displays digital system signals. Many types of logic analyzers are available, ranging from inexpensive ones such as the HiLetgo or Open Workbench Logic Sniffer to professional devices such as the Saleae family (Fig. 7.5), which support higher sampling rates and are more reliable.
We’ll cover using a logic analyzer in Using a Logic Analyzer to Identify UART Pins.
Next, you need to determine the baud rate used by the UART ports, otherwise you will not be able to communicate with the device. Due to the lack of synchronization pulses, the data transfer rate is the only way of synchronous communication between the transmitter and the receiver.

The easiest way to determine the correct baud rate is to connect to the TX pin and try to read the data. If the received data is unreadable, specify the next possible baud rate until the data is readable. This can be done using a USB-to-UART adapter or a multi-purpose device such as Bus Pirate, combined with a helper script such as baudrate.py (https://github.com/devttys0/baudrate/) by Craig Heffner to help automate this process. The most common transfer options are 9600, 38400, 19200, 57600 and 115200; each of them is checked by Heffner’s script by default.
Like UART, JTAG and SWD interfaces on embedded IoT devices can help take control of the device. In this section, we’ll look at the basics of these interfaces and how to interact with them. You will find a detailed example of how to interact with SWD in the Hacking Device Using UART and SWD section.
As manufacturers produced smaller and denser components, testing them became more difficult. Engineers used a testing process called a “nail cheat sheet” to test the hardware for defects: they placed the circuit board on a matrix of spring-loaded pin contacts and checked whether there was an electrical connection between the correct pins. When manufacturers began to use multilayer boards and chip packages with solder ball contacts, such devices no longer provided access to all nodes on the board.
JTAG solved this problem by introducing a more efficient alternative to the crib of nails – edge scanning. Edge scanning analyzes specific patterns, including built-in edge scanning cells and registers for each pin. Using edge-scan cells, engineers can more easily than ever before verify that a certain point on a PCB is properly connected to another point.
Edge scanning commands
The JTAG standard defines specific commands for boundary scanning, including the following:
BYPASS – allows you to test a specific chip without the overhead of passing through other chips;
SAMPLE / PRELOAD – takes a sample of data entering and leaving the structure when it is in normal operating mode;
EXTEST – sets and reads the state of contacts.
A device must support these commands to be considered JTAG compatible. Devices may support additional commands such as IDCODE (to identify the device), INTEST (to internally test the device), etc. You may encounter these instructions when using a tool such as JTAGulator (see Identifying JTAG Pins) to identify JTAG pins.
Edge scanning involves testing the four-wire Test Access Port (TAP), a general-purpose port that provides access to the JTAG test support functions built into the component. It uses a 16-step state machine that moves from state to state. Note that JTAG does not define any protocol for inputting or outputting data from the chip.
TAP uses the following five signals:
Test clock input (TCK). TCKs are clocks that determine how often the TAP controller will perform one action (in other words, move to the next state in the end device). The clock frequency is not specified in the JTAG standard. A device performing a JTAG test can determine its value;
Test Mode Selection Input (TMS). TMS manages the end device. With each clock pulse, the device’s JTAG TAP controller checks the voltage on the TMS pin. If the voltage is below a certain threshold, the signal is considered low and interpreted as 0; if the voltage is above a certain threshold, the signal is considered high and interpreted as 1;
Test Data Input (TDI). This is the pin that sends data to the chip through the scan cells. Each provider is responsible for defining the communication protocol through this PIN code, since JTAG does not define it. The signal presented in TDI is sampled on the rising edge of TCK;
Test Data Output (TDO). The TDO is the pin through which data is received from the chip. According to the standard, changes in the state of the signal transmitted through the TDO should occur only at the leading edge of the TSC;
Reset Test Input (TRST). The optional TRST resets the final state to a known good state. Active at low level (0). Also, if TMS is held at 1 for five consecutive clock cycles, it causes a reset as well as the TRST output; therefore, TRST is optional.
SWD is a two-pin electrical interface that works very similar to JTAG. While JTAG was created primarily for chip and board testing, SWD is a protocol designed specifically for ARM debugging. With the widespread adoption of ARM processors in the IoT world, SWD is becoming increasingly important. If you find the SWD interface, you can almost always take full control of the device.
The SWD interface requires two pins: the bidirectional signal SWDIO, which is the equivalent of the TDI, TDO, and JTAG clock pins, and SWCLK, which is the equivalent of TCK in JTAG. Many devices support a Serial Wire or JTAG Debug Port (SWJ-DP), a combined JTAG and SWD interface that allows you to connect a SWD or JTAG probe to a target device.
Various tools allow us to exchange data with JTAG and SWD. Popular tools include the Bus Blaster FT2232H chip, as well as any tool with an FT232H chip, such as the Adafruit FT232H patch board, Shikra, or Attify Badge. Bus Pirate can also support JTAG if you download custom firmware to it, but we don’t recommend using this feature as it can be unstable. Black Magic Probe, a specialized JTAG and SWD hacking tool, has built-in support for GNU Debugger (GDB), which is useful because you won’t need additional programs like Open On-Chip Debugger (OpenOCD) (see “Installing OpenOCD” below) . Segger’s professional debugging tool, the J-Link Debug Probe, supports JTAG, SWD and even SPI, but comes with proprietary software. If you only want to work with SWD, you can use a tool like the ST-Link programmer (see Hacking a Device Using UART and SWD below).
Additional tools, their descriptions, and useful links are presented in the IoT Hacking Tools section.
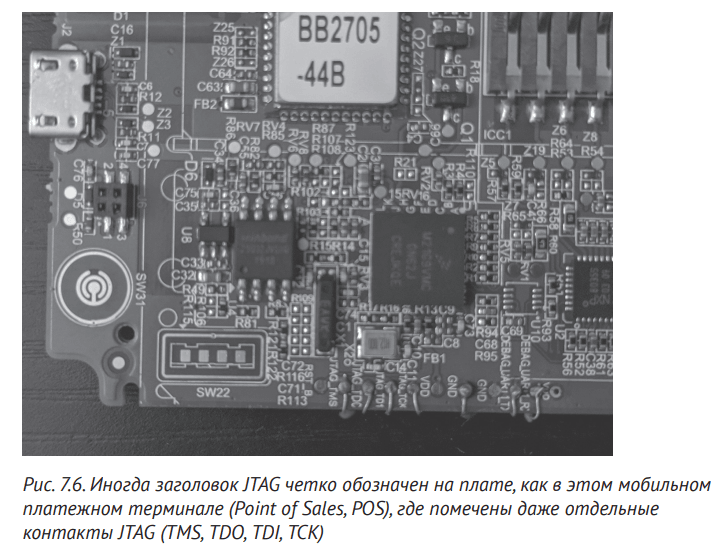
Sometimes there is a marking on the printed circuit board indicating the location of the JTAG connector (Fig. 7.6). But in most cases, you will have to find the connector yourself, as well as find out which pins correspond to the four signals (TDI, TDO, TCK and TMS).
You can use several approaches to identify the JTAG pins on the target device. The fastest but most expensive way to discover JTAG ports is to use a JTAGulator, a device designed specifically for this purpose (although it can also discover UART thermostats). The tool shown in fig. 7.7, has 24 channels that can be connected to board contacts. It performs an iterative scan by issuing IDCODE and BYPASS edge scan commands for each pin combination and waits for a response. When a response is received, it displays the channel corresponding to each JTAG signal, allowing the JTAG thermostats to be identified.

To use the JTAGulator, connect it to your computer with a USB cable, and then connect to it via a serial port (for example, using the screen utility in Linux). An example of communication through a serial port will be shown below in the section “Connecting a USB to a serial adapter”. You can watch JTAGulator creator Joe Grand demonstrate his development: https://www.youtube.com/watch?v=uVIsbXzQOIU/.
A cheaper but much slower way to identify JTAG thermostats is to use the JTAGenum utility (https://github.com/cyp hunk/JTAGenum/) loaded on an Arduino-compatible microcontroller, such as the STM32F103 Black/Blue Pill modules we’ll cover in section “Harnessing the device using UART and SWD”. Using JTAGenum, you must first define the pins of the probe device that you will use for enumeration. For example, for the STM32 Blue Pill module, we chose the following pins (but you can change them):
#elif defined(STM32) // STM32 bluepill,
 byte pins[] = { 10 , 11 , 12 , 13 , 14 , 15 , 16 , 17, 18 , 19 , 21 , 22 };
You will need to refer to the pin diagram of the device and then connect those pins to the reference points on the target device. Next, you need to flash the Arduino JTAGenum code (https://github.com/cyphunk/JTAGenum/blob/master/JTAGenum.ino/) to the device and communicate with it via the serial port (the s command will scan the JTAG combinations).
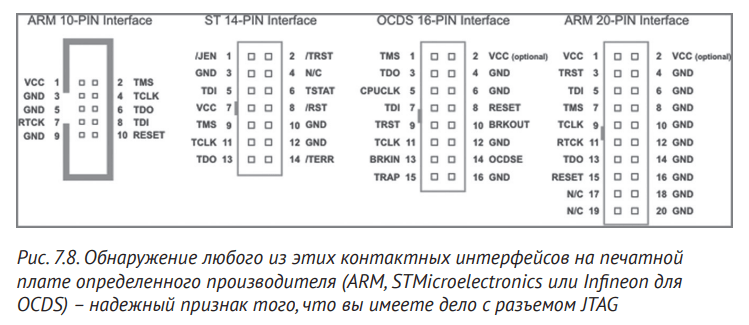
A third way to identify JTAG pins is to check the printed circuit board for one of the connectors shown in Fig. 7.8. In some cases, PCBs may conveniently provide a Tag-Connect interface that explicitly indicates that the board also has a JTAG connector. You can see what this interface looks like on the page https://www.tag-connect.com/info/. Also, checking the chipset tables on the PCB may reveal thermistor patterns pointing to JTAG interfaces.
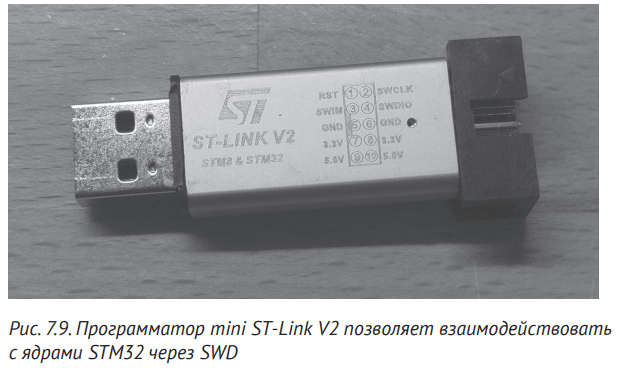
In this section, we will use the microcontroller’s UART and SWD ports to extract data from the device’s memory and bypass the firmware authentication procedure. To attack the device, we will use two tools: the ST-Link mini-programmer and the USB-UART adapter.
The ST-Link mini-programmer (Fig. 7.9) allows us to communicate with the target device using SWD.
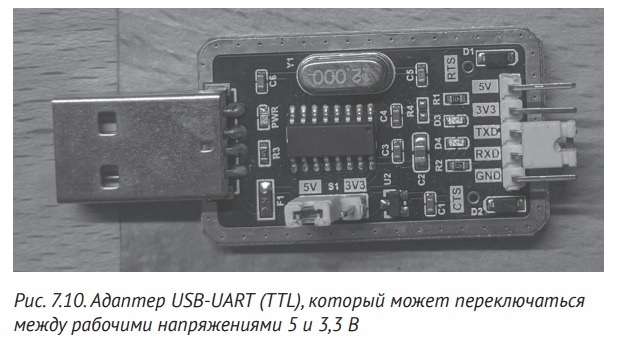
The USB-UART adapter (Fig. 7.10) allows us to communicate with the UART contacts of the device through the USB port of our computer. This adapter is a transistor-transistor logic (TTL) device, meaning it uses 0 and 5V to represent logic levels 0 and 1, respectively. Many adapters use the FT232R chip and you can easily find it if you search the internet for USB to serial adapters.
You will need at least ten jumpers to connect the devices to each other. We also recommend purchasing a breadboard on which you can securely install the Black Pill module. You should be able to purchase these hardware components online. We specifically chose the components used here because they are easy to find and inexpensive. But if you want an alternative to the ST-Link programmer, you can use the Bus Blaster, and as an alternative to the USB-to-UART adapter, you can use the Bus Pirate board.
On the software side, we’ll use an Arduino to code the authentication program we attack; OpenOCD with GDB is suitable for debugging. The following sections show how to set up this test and debug environment. STM32F103C8T6 target device (black pill)
The STM32F103xx is a very popular family of low-cost microcontrollers used in a variety of applications in the industrial, medical, and consumer markets. Such a microcontroller has a 32-bit RISC ARM Cortex-M3 core operating at a frequency of 72 MHz, flash memory up to 1 MB, static random access memory (SRAM) up to 96 KB, as well as a wide range of I/O devices and peripheral devices.
The two versions of this device are known as Blue Pill and Black Pill (depending on the color of the board). We will use the Black Pill (STM32F103C8T6) as the target device. The main difference between the two versions is that the Black Pill uses less energy and is stronger than the Blue Pill. The device can be purchased in online stores. We recommend ordering a board with pre-soldered comb connectors and a flashed Arduino bootloader: so you don’t have to solder the connectors, and you can use the device directly via USB. But in this exercise, we will show you how to download a program for the Black Pill without an Arduino bootloader.
NOTE We chose the Black Pill because we encountered some problems when using the Blue Pill with the UART interface. We strongly recommend that you try the Black Pill instead of the cheaper Blue Pill version.
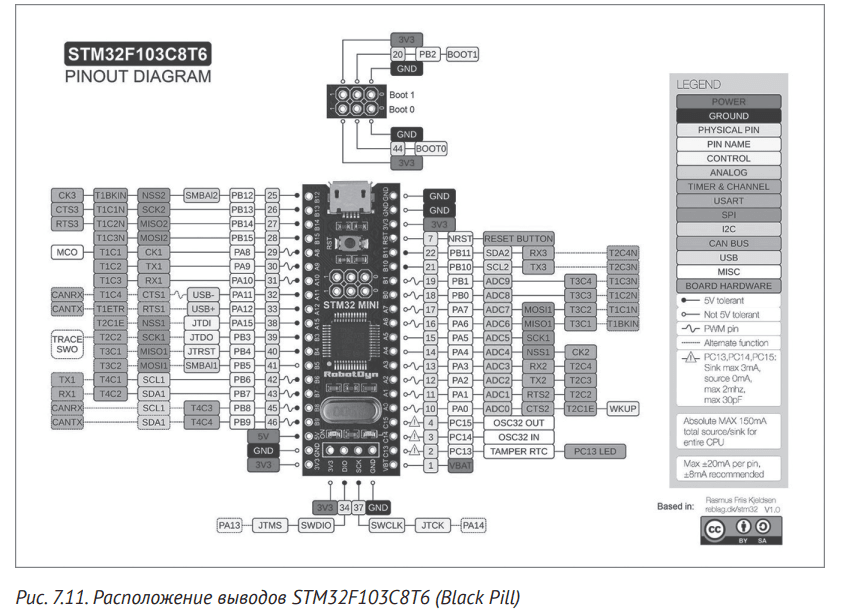
Fig. 7.11 shows the location of the contacts of the device. Note that not all pins are 5V resistant, so we won’t exceed 3.3V. If you want to learn more about the internals of the STM32 microcontroller in general, here’s a very good reference: https://www.rlocman.ru/forum/ showthread.php?t=22505.
Make sure you don’t connect the 5V output to any of the 3.3V pins or you’ll likely break the Black Pill.
Let’s start by programming the target device using the Arduino Integrated Development Environment (IDE). Arduino is a low-cost, easy-to-use, open-source electronics platform that allows you to program microcontrollers using the Arduino programming language. Its IDE includes a text editor for writing code, a PCB and library manager, built-in functions for verifying, compiling and uploading code to the Arduino board, and a serial port monitor for displaying hardware output.
You can download the latest version of the Arduino IDE at https:// www.arduino.cc/en/Main/S oftware/. Our example uses version 1.8.9 on Ubuntu 18.04.3 LTS, but it doesn’t matter what operating system you have. On Linux, download the package manually and follow the instructions at https://www.arduino.cc/en/guide/linux/. Also, if you’re using a Debian-based distribution like Kali or Ubuntu, typing the following command in a terminal will install everything you need:
# apt-get install arduino
After installing the IDE, download the latest Arduino STM32 core files from GitHub, place them in the hardware folder in the Arduino sketches directory, and run the udev rules setup script.
$ wget https://github.com/rogerclarkmelbourne/Arduino_STM32/archive/master.zip
$ unzip master.zip
$ cp -r Arduino_STM32-master /home/ithilgore/Arduino/hardware/
$ cd /home/ithilgore/Arduino/hardware/Arduino_STM 32-master/tools/linux
$ ./install.sh
Make sure you replace the username after /home/ with the username you are using. If the hardware folder does not exist, create it. To find out where the Arduino thumbnails are stored, start the Arduino IDE by typing arduino in the terminal or by clicking the Arduino icon on the desktop. Then go to File>>Preferences and enter the path to the file in the Sketchbook Location field. In our example, it is /home/<ithilgore>/Arduino.
You will also need to install the 32-bit version of libusb-1.0 as follows (because the st-link utility that comes with the Arduino STM32 requires it):
$ sudo apt-get install libusb-1.0-0:i386
We also install Arduino SAM boards (Cortex-M3). These are Cortex-M3 microcontroller cores. Cores are low-level APIs that make certain microcontrollers compatible with your Arduino IDE. You can install them internally and in the Arduino IDE by clicking Tools > Board > Boards >> Manager. Next, find the SAM boards. Click Install (Install) on the Arduino SAM Boards (32-bit ARM Cortex-M3) panel that appears. We used version 1.6.12.
The latest Arduino STM32 installation instructions can be found at https://github.com/rogerclarkmelbourne/Arduino_STM32/wiki/Installation/.
OpenOCD is a free, open source test tool that provides JTAG and SWD access via GDB to ARM, MIPS, and RISC-V systems. We will use it to debug Black Pill. To install it on your Linux system, enter the following commands:
$ sudo apt-get install libtool autoconf texinfo libusb-dev libftdi-dev libusb-1.0
$ git clone git://git.code.sf.net/p/openocd/code openocd
$ cd openocd
$ ./bootstrap
$ ./configure --enable-maintainer-mode --disable-werror --enable-buspirate --enable-ftdi
$ make
$ sudo make install
Note that you are also installing libusb-1.0, which will need to enable support for Future Technology Devices International (FTDI). Then compile OpenOCD from source code. This allows us to enable support for FTDI devices and the Bus Pirate tool.
To learn more about OpenOCD, please refer to the detailed user guide: http://openocd.org/doc/html/index.html.
GDB is a portable debugger that runs on Unix-like systems. It supports many target processors and programming languages. We will use GDB to remotely monitor and modify the execution of the target program.
On Ubuntu, you’ll need to install the original gdb and gdb-multiarch packages, which extend GDB support to multiple target architectures, including ARM (the architecture behind the Black Pill). You can do this by entering the following command in the terminal:
$ sudo apt install gdb gdb-multiarch
Now let’s write a program on Arduino, which we will upload to Black Pill and try to hack it. During real-world testing, you may not have access to the device’s source code, but we’re showing it to you for two reasons. First, you will learn how the Arduino code is converted into a binary file that can be loaded onto the device. Second, when you debug with OpenOCD and GDB, you’ll see how the assembler code matches the source code.
The program in Listing 7.1 uses a serial interface to send and receive data. It simulates the authentication process by checking the password. If the correct password is received from the user, the message “ACCESS GRANTED” is displayed. Otherwise, the user will be prompted to log in again.
Code listing 7.1. Arduino serial communication program for STM32F103 chip
const byte bufsiz = 32;
char buf[bufsiz];
boolean new_data = false;
boolean start = true;
void setup() {
 delay(3000);
 Serial1.begin(9600);
}
void loop() {
 if (start == true) {
 Serial1.print("Login: ");
 start = false;
 }
 recv_data();
 if (new_data == true)
 validate();
}
void recv_data() {
 static byte i = 0;
 static char last_char;
 char end1 = '\n';
 char end2 = '\r';
 char rc;
while (Serial1.available() > 0 && new_data == false) {
 rc = Serial1.read();
 // пропускаем следующий символ, если предыдущий был \r или \n и текущий \r или \n
 if ((rc == end1 || rc == end2) && (last_char == end2 || last_char == end1))
 return;
 last_char = rc;
 if (rc != end1 && rc != end2) {
 buf[i++] = rc;
 if (i >= bufsiz)
 i = bufsiz - 1;
 } else {
 buf[i] = '\0'; // terminate the string
 i = 0;
 new_data = true;
 }
 }
}
void validate() {
 Serial1.println(buf);
 new_data = false;
 if (strcmp(buf, "sock-raw.org") == 0)
 Serial1.println("ACCESS GRANTED");
 else {
 Serial1.println("Access Denied.");
 Serial1.print("Login: ");
 }
}
Let’s start by defining four world variables. The bufsiz variable contains the number of bytes for the character array buf, which stores the bytes coming through the serial port from the user or the device communicating with the port. The new_data variable is a boolean value that becomes true whenever the main program loop receives a new row of sequential data. The boolean start is only true on the first iteration of the main loop, so it outputs the first “Login” prompt. The setup() function is a built-in Arduino function that is executed once during program initialization. Inside this function, we initialize the serial interface (Serial1.begin) with a speed of 9600 bits per second.
Note that Serial1 is different from Serial, Serial2 and Serial3 – they all correspond to different UART pins on the Black Pill. Object Serial1 corresponds to pins A9 and A10. The loop() function is another built-in Arduino function that is automatically called after setup(), loops and executes the main program. It constantly calls the recv_data() function, which is responsible for receiving and validating data from the serial port.
When the program has finished receiving all the bytes (this happens when new_data becomes true), loop() calls the validate() function, which checks whether the received bytes are a valid passphrase. The recv_data() function begins by defining two static variables (which means their value will persist between each call to this function): i to iterate through the buf array, and last_char to store the last character we read from the serial port. The while loop checks if there are any bytes available to read from the serial port (via Serial1.available), reads the next available byte using Serial1.read, and checks if the previously stored character (which is stored in last_char ) is a carriage return ‘\r’ or newline ‘\n’.
A loop does this because it can encounter devices sending carriage returns, newlines, or both to terminate their lines when sending serial data. If the next byte does not indicate the end of the line, we store the just read byte rc in buf and increment the counter i by one. If i reaches the end of the buffer length, the program no longer stores new bytes in the buffer.
If the byte read represents the end of the line, meaning the serial user most likely pressed Enter, we null-terminate the line in the array, reset the i counter, and set new_data to true. In this case, we call the validate() function, which prints the resulting string and compares it to the correct password. If the password is correct, ACCESS GRANTED is displayed. Otherwise, Access Denied is displayed and the user is prompted to log in again.
Now upload the Arduino program to Black Pill. The sequence of steps depends on whether you purchased the module with the Arduino bootloader pre-installed, but we’ll cover both options. Another way to boot the program is to use a serial adapter that allows you to flash your own bootloader (see, for example, https://github.com/rogerclarkmelbourne/STM32duino-bootloader/), but we will not cover this process here – you can find many resources on this topic.
Anyway, let’s use the ST-Link programmer and write the program to the main flash memory. If you encounter problems writing to flash memory, write to built-in RAM. The main problem with this approach is that you have to reload the Arduino program every time you turn the device off and on, because the SRAM contents are lost every time the device is turned off.
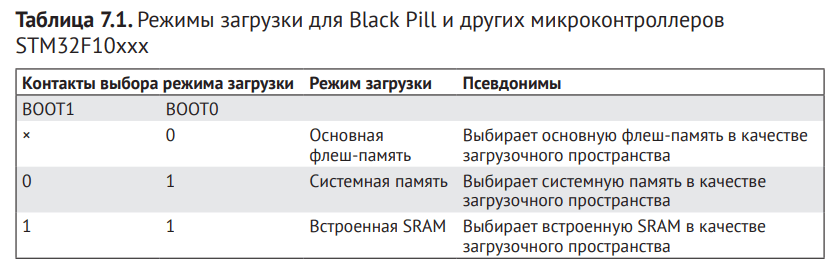
To ensure that you download the program to the BlackPill memory, you need to select the correct download mode. The STM32F10xxx has three different boot modes that can be selected using the BOOT1 and BOOT0 pins, as shown in Table 1. 7.1. Refer to the contact diagram in fig. 7.11 to find these two contacts on Black Pill.
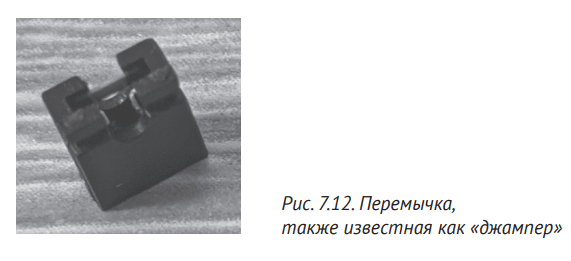
Use the jumper that comes with the Black Pill to select the download mode. A jumper is a collection of small contacts in a plastic case that create an electrical connection between two contacts (Fig. 7.12). You can use a jumper pin to connect the boot mode select pins to VDD (logic 1) or GND (logic 0).
Jumper both BOOT0 and BOOT1 Black Pill pins to GND. If you want to write to SRAM, you need to connect both pins to VDD.
To boot the program, first make sure the jumpers for BOOT0 and BOOT1 are connected to GND. Create a new file in the Arduino IDE, copy and paste the code in Listing 7.1, and then save the file. We used the name serial-simple. Click on “Tools” >> “Board” and select “Generic STM32F103C Series” under STM32F1 “Boards”. Then click Tools > >Variant and make sure STM32F103C8 (20k RAM, 64k Flash ) is installed; It should be set by default. Make sure the Tools > Upload method is set to STLink and ideally the Optimize option is set to Debug (-g) . This ensures that the debug characters will appear in the final binary. Do not change other parameters.
If you had an Arduino bootloader installed on the Black Pill, you can connect it directly to your computer via a USB cable without the ST-Link programmer. Then specify the boot method via STM32duino bootloader instead of STLink. But for tutorial purposes, we will be using the ST-Link programmer, so you don’t need to flash the bootloader first.
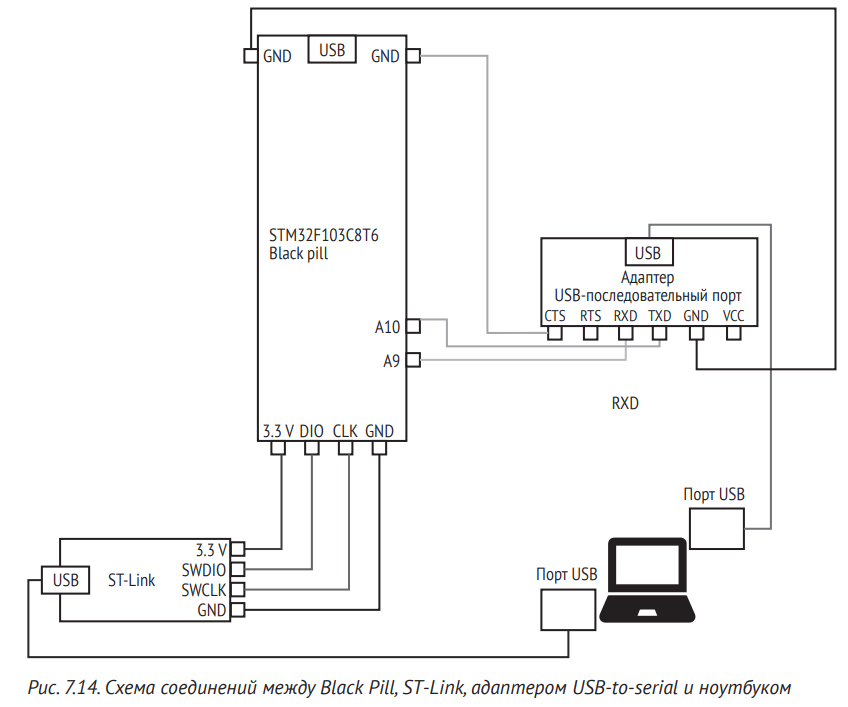
To load the program into the Black Pill, connect the ST-Link programmer to this module. Using the four jumpers, connect the SWCLK, SWDIO, GND and 3.3V ST-Link pins to the CLK, DIO, GND, 3.3V Black Pill pins respectively. These contacts are located at the bottom of the Black Pill connector. How it looks is shown in fig. 7.14 and 7.15.
CAUTION Do not connect any devices to the USB ports until the connection is complete. It is recommended to avoid applying power to the devices when connecting their contacts. In this way, you will avoid accidental short-circuiting of the contacts, which can lead to their failure when the devices are turned on.
Now locate the UART pins on the device. Above we showed you how to do this with a multimeter, but now we’ll use a logic analyzer to identify the UART TX pin. The TX pin transmits the output signal, so it is easy to identify. For this exercise, you can use the inexpensive HiLetgo eight-channel USB logic analyzer, as it is compatible with the Saleae Logic software we use.
Download this software for your operating system from https://saleae.com/downloads/. (Our example uses the Linux version.) Extract the package to a local folder, navigate to it in a terminal, and type the following:
$ sudo ./Logic
This command will open the Saleae Logic GUI. Leave it open for now.
Make sure that all systems under test are turned off when the logic analyzer probes are connected to them to avoid short circuits. In this case, since the Black Pill is powered by the ST-Link programmer, temporarily disconnect the programmer from the computer’s USB port. Remember that if you disable the Black Pill after loading the Arduino code into SRAM instead of flash, you will have to reload the code into the module.
Use a jumper wire to connect one of the logic analyzer’s GND pins to one of the Black Pill’s GND pins so that they share a “ground”. Then, using two more jumpers, connect channels CH0 and CH1 of the logic analyzer (all channel contacts must be labeled) to terminals A9 and A10 of the Black Pill. Connect the logic analyzer to the USB port of the computer.
In the Saleae interface, you should see at least a couple of channels on the left panel, each corresponding to one of the inference logic analyzer channels. You can always add more channels if your logic analyzer supports them so you can monitor more outputs simultaneously. Add them by clicking the two arrows next to the green Start button to open Settings. You can then choose how many channels you want to display by toggling the number next to each channel.
In the settings, increase the Speed to 50 kS/s and the Duration to 20 seconds. As a rule, the sampling rate of digital signals should be at least four times higher than their repetition rate. For a slow serial channel, a sample rate of 50 kSm/s is more than sufficient, although a higher sample rate would not hurt. As for the duration, then 20 seconds is enough for the device to turn on and start transmitting data.
Press the “Start” button to begin capturing signals and immediately turn on the “Black Pill” by connecting the ST-Link programmer to the USB port. The session will last 20 seconds, but you can stop it at any time. If channel data is not displayed, try enabling and re-enabling Black Pill during the session. At some point you should see a signal coming out of the channel corresponding to the A9 (TX) pin. Zoom in or out by rotating the mouse wheel to see them more clearly.
To decode the data, click the “+” button next to the “Analyzers” tab in the GUI, select “Asynchronous Serial” on the right side of the panel, select the channel you are reading the signal on, and set the bitrate to 9600. Note. If you don’t know the flow rate, you can select Use autobode (Use automatic rate negotiation) and let the program work all its magic to find the value you need. You should now see the Login: Arduino programs prompt as a series of UART packets in the signal you just captured (Figure 7.13).
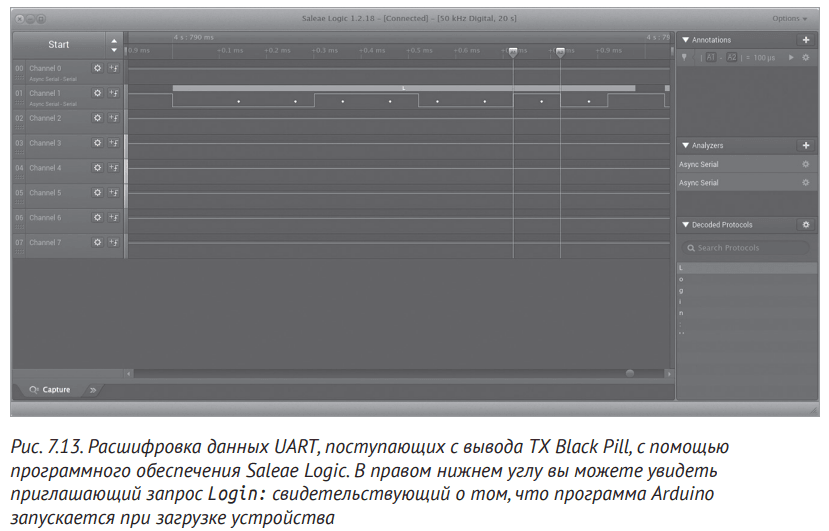
Pay attention to how the device in fig. 7.13 sends the letter L, which indicates the beginning of the login message. Communication starts with an unoccupied line (with logical value 1). The Black Pill then sends a start bit with a logic value of 0, followed by the data bits from lowest to highest. The letter L corresponds to the code 0x4C in ASCII, or 00110010 in binary, as you can see in the transmission. Finally, the Black Pill sends a stop bit (with a logical value of 1) before the beginning of the letter “o”.
We placed two time markers (A1 and A2 in Figure 7.13) on either side of a single random bit. Timestamps are a kind of flags or labels that can be used to measure the time elapsed between any two data points. We measured a duration of 100 µs, which proves that the transfer rate is 9600 bps. (It takes 1/9600 s, or 0.000104 s, or about 100 µs to transmit one bit.)
To test the USB-UART adapter, let’s connect it to our computer. Some adapters, including the one we used, come with a jumper pre-installed on the RX and TX pins (Figure 7.12). A jumper connects the RX and TX contacts, creating a loop between them. This is useful for testing the adapter by plugging it into a computer’s USB port and then opening a terminal emulator program, such as screen or minicom, for that port. Try using a terminal emulator to send serial data to connected devices. If you see keystrokes in the terminal, this means that the adapter is working. The fact is that your keyboard sends characters through the USB port to the TX pin of the adapter; through the jumper, the characters are sent to the RX pin, and then returned to the computer through the USB port.
Connect the adapter to the computer (without removing the jumper), and then type the following command to find out which device file token is assigned to the adapter:
$ sudo dmesg
…
usb 1-2.1: FTDI USB Serial Device converter now attached to ttyUSB0
Normally, the /dev/ttyUSB0 handle is assigned to apter if no other peripherals have been connected to the port. Then run the screen command and pass the file handle as an argument:
$ screen /dev/ttyUSB0
To exit a screen session, press Ctrl+A followed by \.
You can also specify the bitrate as a second argument. To find out your adapter’s current baud rate, type the following:
$ stty -F /dev/ttyUSB0
speed 9600 baud; line =0;
…
This output shows that the adapter has a baud rate of 9600 baud.
Make sure the adapter is working and then remove the jumper pin as you need to connect the RX and TX pins to the Black Pill. Fig. Figure 7.14 shows the necessary connections.
Connect the RX pin of the adapter to the TX pin on the Black Pill (pin A9 in this example). Then connect the TX pin of the adapter to the RX pin (A10). It is important to use pins A9 and A10 because they correspond to the Serial1 interface we used in the Arduino code.
The USB adapter must be connected to the same “ground” wire as the Balck Pill, as the devices use GND as a reference point for voltage levels. The Clear to Send (CTS) output must also be connected to the GND line because it is considered active low (ie logic 0). If this pin is not connected to GND, it will be high and the adapter will not be able to send bytes to the Black Pill.
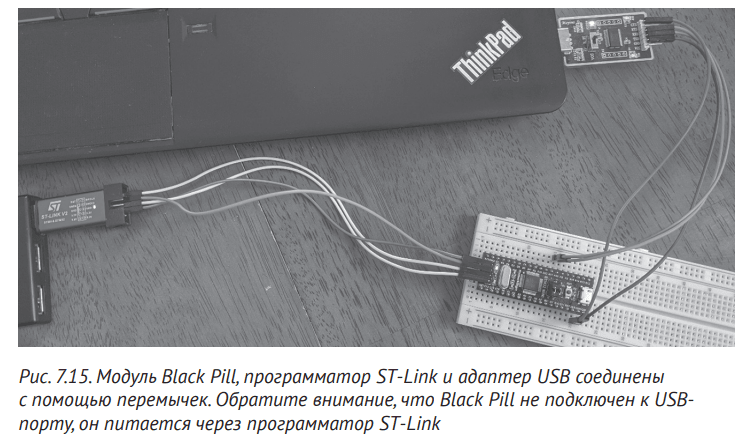
After connecting the Black Pill, ST-Link and USB adapter, connect the ST-Link to the USB port of the computer. Then connect the adapter to the USB port. Fig. Figure 7.15 shows an example of the design.
CAUTION Please note that the Black Pill module is not connected to any USB port. Instead, it works through the ST-Link programmer. Connecting the Black Pill directly to any USB port may cause the module or port to fail.
Now that the test circuit is ready, return to the Arduino development environment. Enable verbose output by clicking File > Preferences and checking the Show verbose output during: compilation check box. Then click Sketch > Upload > to compile the program and upload it to Black Pill.
Since we’ve included verbose output in the Arduino IDE, compiling and loading the program should give you a lot of information about the process, including the temporary directory that holds the intermediate files needed for compilation (Figure 7.16).
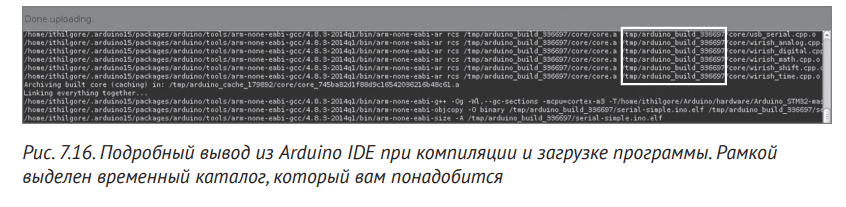
On Linux, this directory usually looks like /tmp/arduino_build_336697, where the last number is a random ID (you’ll obviously have a different one) that changes with new builds. When compiling the program, pay attention to this directory: you will need it later.
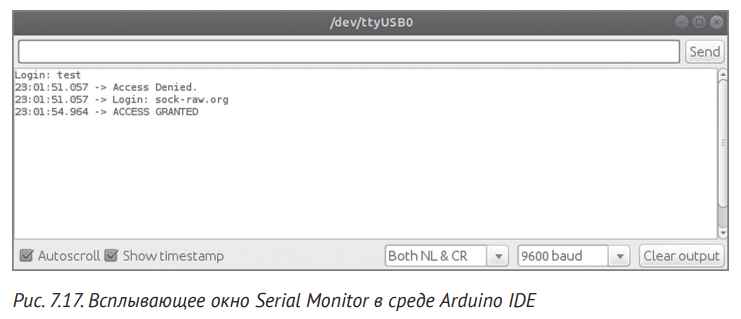
At this point, open the Serial Monitor console by clicking Tools > Serial >Monitor. The Serial Monitor is a pop-up window that can send and receive UART data to and from the Black Pill module. It is similar in functionality to the screen tool used earlier, but built into the Arduino IDE for convenience. Click Tools > >Port to make sure you select the USB port to which the USB serial adapter is connected. Make sure the baud rate in the Serial Monitor window settings is 9600 as we specified in the code. After that, you should see the Login: prompt of our Arduino application. Enter sample text to test the application. Fig. 7.17 shows an example session.
If you type anything other than sock-raw.org you will get an access denied message. Otherwise, the message ACCESS GRANTED will appear.
Now it’s time for the main exercise: debugging and hacking the Black Pill. If you have completed all the previous steps, you should have a fully working debugging environment and the Black Pill should contain the Arduino program we wrote.
We will use OpenOCD to communicate with the Black Pill via the SWD through the ST-Link programmer. Let’s do this to open a remote diagnostic session using GDB. Then, using GDB, step through the program’s instructions and bypass its authentication check.
Let’s run OpenOCD as a server. We need it to communicate with Black Pill via SWD. To run it with the Black Pill STM32F103 core using ST-Link, we have to specify the two relevant configuration files with the -f switch:
$ sudo openocd -f /usr/local/share/openocd/scripts/interface/stlink.cfg -f /usr/local/share/
openocd/scripts/targets/stm32f1x.cfg
 [sudo] password for ithilgore:
Open On-Chip Debugger 0.10.0+dev-00936-g0a13ca1a (2019-10-06-12:35)
Licensed under GNU GPL v2
For bug reports, read
 http://openocd.org/doc/doxygen/bugs.html
Info : auto-selecting first available session transport "hla_swd". To override use
'transport
select <transport>'.
Info : The selected transport took over low-level target control. The results might differ
compared to plain JTAG/SWD
Info : Listening on port 6666 for tcl connections
Info : Listening on port 4444 for telnet connections
Info : clock speed 1000 kHz
Info : STLINK V2J31S7 (API v2) VID:PID 0483:3748
Info : Target voltage: 3.218073
Info : stm32f1x.cpu: hardware has 6 breakpoints, 4 watchpoints
Info : Listening on port 3333 for gdb connections
These configuration files help OpenOCD understand how to interact with devices that use JTAG and SWD. If you installed OpenOCD from source as shown above, these settings files should be located in the /usr/local/share/ openocd directory. After running the command, OpenOCD will start accepting local Telnet connections on TCP port 4444 and GDB connections on TCP port 3333.
At this point, we’ll open an OpenOCD session via Telnet and start sending Black Pill commands via SWD. In another terminal, type:
$ telnet localhost 4444
Trying 127.0.0.1...
Connected to localhost.
Escape character is '^]'.
Open On-Chip Debugger
> reset init
target halted due to debug-request, current mode: Thread
xPSR: 0x01000000 pc: 0x08000538 msp: 0x20005000
> halt
> flash banks
#0 : stm32f1x.flash (stm32f1x) at 0x08000000, size 0x00000000, buswidth 0, chipwidth 0
> mdw 0x08000000 0x20
0x08000000: 20005000 08000539 080009b1 080009b5 080009b9 080009bd 080009c1 08000e15
0x08000020: 08000e15 08000e15 08000e15 08000e15 08000e15 08000e15 08000e15 08000e35
0x08000040: 08000e15 08000e15 08000e15 08000e15 08000e15 08000e15 08000a11 08000a35
0x08000060: 08000a59 08000a7d 08000aa1 080008f1 08000909 08000921 0800093d 08000959
> dump_image firmware-serial.bin 0x08000000 17812
dumped 17812 bytes in 0.283650s (61.971 KiB/s)
The reset init command stops the target device and performs a hard reset by executing the reset-init script. This script is an event handler that performs tasks such as setting clock pulses and JTAG clock frequency. You can find examples of these handlers by looking at the .cfg files in the openocd/scripts/target/ directory. The halt command sends a halt request to cause the device to stop. and entered debug mode.
The flash banks command outputs a one-line summary of each flash bank that was specified in the OpenOCD .cfg file (in this case, stm32f1x.cfg). It prints the main Black Pill flash memory, which starts at address 0x08000000. This step is important because it will help you determine which memory segment to dump the firmware from. Note that sometimes the size value is specified incorrectly.
The best resource for this step remains to look at datasheets. We then send a 32-bit memory access command to mdw starting at the previously found address to read and display the first 32 bytes of flash memory. Finally, we unload the target memory from this address (17,812 bytes in total) and store it in the file firmware-serial.bin in the local directory of our computer. We received the number 17 812, requesting the volume of the Arduino program file loaded into the flash memory. To do this, enter the following command from the temporary directory of the Arduino compiler:
/tmp/arduino_build_336697 $ stat -c '%s' serial-simple.ino.bin
17812
You can then use comparison tools like colordiff and xxd to see if there are any differences between the firmware-serial.bin file we downloaded from flash.bin and the serial-simple.ino file we downloaded via Arduino IDE If you saved exactly as many bytes as the Arduino program, there should be no difference in the colordiff output:
$ sudo apt install colordiff xxd
$ colordiff -y <(xxd serial-simple.ino.bin) <(xxd firmware-serial.bin) | less
We encourage you to experiment with other OpenOCD commands; They are all documented on the tool’s website. Here is a useful command to try:
> flash write_image erase custom_firmware.bin 0x08000000
You can use it to flash new firmware.
Let’s debug and modify the execution flow of an Arduino program using GDB. If the OpenOCD server is already running, we can start a remote GDB session. To make things easier for ourselves, we’ll use the Executable and Linkable File (ELF) file created when we compiled the Arduino program. ELF is a standard file format for executables, object code, shared libraries, and kernel dumps on Unix-like systems. In this case, it acts as an intermediate file during compilation.
Change to the temporary directory created during compilation. Make sure you change the random part of the directory name to the value obtained from your own Arduino build. Then, assuming your Arduino program is named serial-simple, start a remote GDB session using the gdb-multiarch command with the following arguments:
$ cd /tmp/arduino_build_336697/
$ gdb-multiarch -q --eval-command="target remote localhost:3333" serial-simple.ino.elf
Reading symbols from serial-simple.ino.elf...done.
Remote debugging using localhost:3333
0x08000232 in loop () at /home/ithilgore/Arduino/serial-simple/serial-simple.ino:15
15 if (start == true) {
(gdb)
This command will open a GDB session and use the local ELF executable (named serial-simple.ino.elf) created by Arduino during compilation for debugging symbols. Debugger symbols are primitive data types that allow debuggers to access information such as variable and function names from the binary source code.
Now you can use this terminal to send GDB commands. Start by typing the info functions command to make sure the symbols are actually loaded:
(gdb) info functions
All defined functions:
File /home/ithilgore/Arduino/hardware/Arduino_STM32-master/STM32F1/cores/maple/HardwareSerial.
cpp:
HardwareSerial *HardwareSerial::HardwareSerial(usart_dev*, unsigned char, unsigned char);
int HardwareSerial::available();
…
File /home/ithilgore/Arduino/serial-simple/serial-simple.ino:
void loop();
void recv_data();
void setup();
void validate();
Now let’s set a breakpoint on the validate() function, because as the name suggests, it performs some kind of validation that might be related to authentication.
(gdb) break validate
Breakpoint 1 at 0x800015c: file /home/ithilgore/Arduino/serial-simple/serial-simple.ino, line
55.
Since the debugging information written to an ELF binary tells GDB what source files were used to build it, we can use the list command to print parts of the program’s source code. This handy feature is rarely provided in real-world reverse engineering scenarios where you have to rely on the disassembler command to show the assembler code instead of the source code. Here is the result of both teams:
 (gdb) list validate,
55 void validate() {
56 Serial1.println(buf);
57 new_data = false;
58
59 if (strcmp(buf, "sock-raw.org") == 0)
60 Serial1.println("ACCESS GRANTED");
61 else {
62 Serial1.println("Access Denied.");
63 Serial1.print("Login: ");
64 }
(gdb) disassemble validate
Dump of assembler code for function validate():
 0x0800015c <+0>: push {r3, lr}
 0x0800015e <+2>: ldr r1, [pc, #56] ; (0x8000198 <validate()+60>)
 0x08000160 <+4>: ldr r0, [pc, #56] ; (0x800019c <validate()+64>)
 0x08000162 <+6>: bl 0x80006e4 <Print::println(char const*)>
 0x08000166 <+10>: ldr r3, [pc, #56] ; (0x80001a0 <validate()+68>)
 0x08000168 <+12>: movs r2, #0
 0x0800016a <+14>: ldr r0, [pc, #44] ; (0x8000198 <validate()+60>)
 0x0800016c <+16>: ldr r1, [pc, #52] ; (0x80001a4 <validate()+72>)
 0x0800016e <+18>: strb r2, [r3, #0]
 0x08000170 <+20>: bl 0x8002de8 <strcmp>
 0x08000174 <+24>: cbnz r0, 0x8000182 <validate()+38>
 0x08000176 <+26>: ldr r0, [pc, #36] ; (0x800019c <validate()+64>)
…
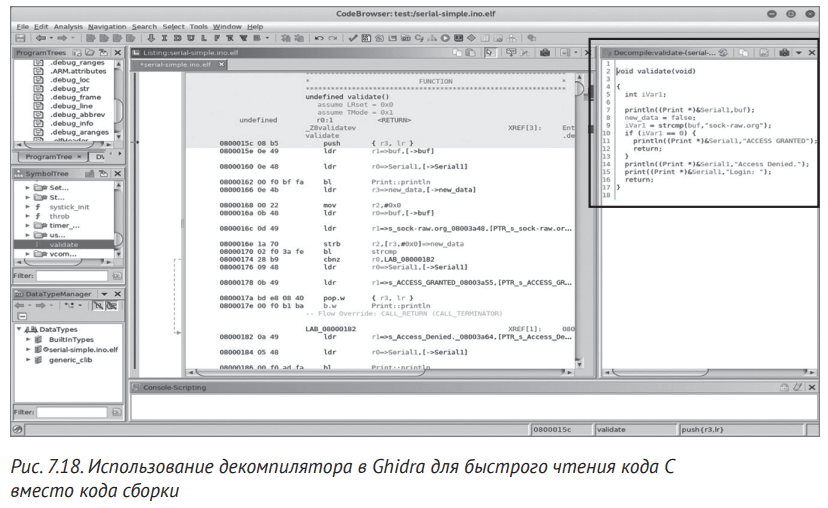
If you only have assembly code, import the file (in this case serialsimple.ino.elf) into a decompiler such as those provided by Ghidra or IDA Pro. This will help you a lot because it will translate the assembly code into C, which is much easier to read (Figure 7.18).
If you only have a hex file (e.g. firmware-serial.bin) as a result of flashing the firmware, you will first need to parse it using ARM tools as follows:
$ arm-none-eabi-objdump -D -b binary -marm -Mforce-thumb firmware-serial.bin > output.s
The output.s file will contain the assembly code. Now let’s see how we can bypass the simple authentication process of our target. To resume normal program execution, type continue (or, for brevity, c):
(gdb) continue
Continuing.
The program now expects serial input. Open the serial port monitor in the Arduino IDE like we did before, type a sample password like test123 and press Enter. In the GDB terminal, you should see the breakpoint for the check function firing. From now on, we will make GDB automatically display the following instruction that will be executed every time the program stops: by running the display/i$pc command. We will then gradually step one machine instruction at a time using the stepi command until we reach the call to strcmp. When we get to the Print::p rintln call, let’s skip it because it doesn’t concern us in this context, as shown in Listing 7.2:
Code listing 7.2. A step-by-step implementation of GDB’s program validation function
Breakpoint 1, validate () at /home/ithilgore/Arduino/serial-simple/serial-simple.ino:55
55 void validate() {
(gdb) display/i $pc
1: x/i $pc
=> 0x800015c <validate()>: push {r3, lr}
(gdb) stepi
halted: PC: 0x0800015e
56 Serial1.println(buf);
3: x/i $pc
=> 0x800015e <validate()+2>: ldr r1, [pc, #56] ; (0x8000198 <validate()+60>)
(gdb) stepi
halted: PC: 0x08000160
0x08000160 56 Serial1.println(buf);
1: x/i $pc
=> 0x8000160 <validate()+4>: ldr r0, [pc, #56] ; (0x800019c <validate()+64>)
(gdb) stepi
halted: PC: 0x08000162
0x08000162 56 Serial1.println(buf);
1: x/i $pc
=> 0x8000162 <validate()+6>: bl 0x80006e4 <Print::println(char const*)>
(gdb) next
halted: PC: 0x080006e4
57 new_data = false;
1: x/i $pc
=> 0x8000166 <validate()+10>: ldr r3, [pc, #56] ; (0x80001a0 <validate()+68>)
(gdb) stepi
halted: PC: 0x08000168
0x08000168 57 new_data = false;
1: x/i $pc
=> 0x8000168 <validate()+12>: movs r2, #0
(gdb) stepi
halted: PC: 0x0800016a
59 if (strcmp(buf, "sock-raw.org") == 0)
1: x/i $pc
=> 0x800016a <validate()+14>:ldr r0, [pc, #44] ; (0x8000198 <validate()+60>)
(gdb) stepi
halted: PC: 0x0800016c
0x0800016c 59 if (strcmp(buf, "sock-raw.org") == 0)
1: x/i $pc
=> 0x800016c <validate()+16>: ldr r1, [pc, #52] ; (0x80001a4 <validate()+72>)
(gdb) stepi
halted: PC: 0x0800016e
57 new_data = false;
1: x/i $pc
=> 0x800016e <validate()+18>: strb r2, [r3, #0]
Уязвимости портов UART, JTAG и SWD  225
(gdb) stepi
halted: PC: 0x08000170
59 if (strcmp(buf, "sock-raw.org") == 0)
1: x/i $pc
=> 0x8000170 <validate()+20>: bl 0x8002de8 <strcmp>
(gdb) x/s $r0
0x200008ae <buf>: "test123"
(gdb) x/s $r1
0x8003a48: "sock-raw.org"
The last two GDB commands (x/s $r0 and x/s $r1) display the contents of registers r0 and r1 as strings. These registers must contain the two arguments passed to Arduino’s strcmp() function because, according to the ARM Procedure Call Standard (APCS), the first four arguments of any function are passed into the first four ARM registers r0, r1, r2, r3. This means that registers r0 and r1 contain the addresses of the string test123 (which we specified as the password) and the string of the valid sock-raw.org password to be compared against.
You can display all registers in GDB at any time by running the command info registers (or i r for brevity). Now we can bypass authentication in several ways. The easiest way is to set r0 to sock-raw.org before execution reaches the strcmp() call. You can easily do this by entering the following GDB command:
set $r0="sock-raw.org"
Also, if we don’t know the correct string value for the passphrase, we can bypass authentication by tricking the program into thinking that strcmp() succeeded. To do this we will modify the return value of strcmp() as soon as it returns. Note that strcmp() returns 0 on success.
We can change the return value using the cbnz command which is designed to compare and cast to a non-null value. It checks the register in the left operand and, if it is not zero, branches to the destination specified in the right operand. In this case, the register is r0, and it contains the value returned by strcmp():
0x08000170 <+20>: bl 0x8002de8 <strcmp>
 0x08000174 <+24>: cbnz r0, 0x8000182 <validate()+38>
We will now jump to the strcmp() function, making another koman do stepi when we reach it. Then we can exit it by executing the exit command. Just before executing the cbnz command, change the value of r0 to 0, indicating that strcmp() succeeded:
(gdb) stepi
halted: PC: 0x08002de8
0x08002de8 in strcmp ()
3: x/i $pc
=> 0x8002de8 <strcmp>: orr.w r12, r0, r1
(gdb) finish
Run till exit from #0 0x08002de8 in strcmp ()
0x08000174 in validate () at /home/ithilgore/Arduino/serial-simple/serial-simple.ino:59
59 if (strcmp(buf, "sock-raw.org") == 0)
3: x/i $pc
=> 0x8000174 <validate()+24>: cbnz r0, 0x8000182 <validate()+38>
(gdb) set $r0=0
(gdb) x/x $r0
0x0: 0x00
(gdb) c
Continuing.
When we do this, our program will not jump to memory address 0x8000182. Instead, it will continue to execute the instructions immediately after the cbnz. If you now allow the program to continue by typing continue, you will see an ACCESS GRANTED message on the Arduino serial monitor indicating that you have successfully hacked the program. There are other ways to hack the app, but we’ll leave it up to you to experiment on your own.
In this chapter, you learned about UART, JTAG, and SWD, and how you can use these protocols to gain full access to your device. Most of the chapter was devoted to practical exercises, where the STM32F103C8T6 (Black Pill) microcontroller was used as the target device. You learned how to design and run a simple Arduino program that performs a very simple authentication procedure via UART. Then connect to the device using a USB-UART serial adapter. We used the ST-Link programmer to access the SWD on the target device via OpenOCD and finally resorted to GDB to dynamically bypass the authentication function.
Using UART, and especially JTAG and SWD, almost always means you can have full access to the device because these interfaces were designed to give manufacturers full debug rights for testing purposes. Learn how to maximize their potential and you’ll learn how to hack IoT devices much more effectively!
We used materials from the book “The Definitive Guide to Attacking the Internet of Things” written by Photios Chantsis, Ioannis Stais, Paulino Calderon, Evangelos Deirmentsoglu and Beau Woods.