Network traffic analysis is becoming an increasingly important task in today’s information society. Maintaining a reliable and secure network is becoming critical for many organizations and users. In this context, tools such as Wireshark and tcpdump become a real salvation. Wireshark is a popular and free network traffic analyzer that allows you to pay attention to every packet of data passing through your network. With its intuitive interface and powerful filtering capabilities, Wireshark has become an indispensable tool for network administrators, security engineers, and anyone interested in performing detailed analysis of network traffic.

Tcpdump, on the other hand, is a command-line tool for monitoring network traffic. It allows you to get detailed information about packets passing through the network without a graphical interface. Tcpdump is a powerful tool for systems engineers with command line skills. In this SEO text, we will look at the general concepts of Wireshark and tcpdump, their role in local networks, and the importance of analyzing network traffic to ensure network reliability and security. Regardless of your level of expertise, knowing these tools can be a significant advantage in managing and securing your network.
The Wireshark app has a very rich history. Gerald Combs. (Gerald Combs), who took a computer science course at the University of Missouri located in Kansas City, developed this application out of necessity. The first version of his program was released under the name Ethereal in 1998 under the GNU General Public License (GPL).
Eight years after the release of the broadcast version, Combs left the job to pursue other career opportunities. Unfortunately, his employer at the time retained all rights to the Ethereal trademark, and therefore Combs was unable to obtain consent to control the Ethereal trademark. Therefore, Combs and the rest of the development team renamed their project Wiresharh in mid-2006.
Now the popularity of the Wireshark program has increased significantly, and more than 500 specialists participated in its development. At the same time, the application, which exists under the name Ethereal, is no longer being developed.
The Wireshark application offers a number of advantages that make it very attractive for everyday use. It caters to different categories of package analysts, from novice to experienced, providing attractive opportunities for both. So, let’s explore Wireshark’s capabilities using the criteria defined in Chapter 1, “Packet and Network Sniffing Basics,” to select packet sniffing tools.
Support of network protocols. Wireshark supports a number of network protocols—at the time of this writing there are about 1,000 of them. Supported network protocols include both common protocols such as IR and DHCP, and more advanced specialized protocols such as DNP3 and BitTorrent. And since the Wireshark application is developed according to the open source model, when it is updated, support for a new network protocol is introduced.
Ease of use. Wireshark’s interface is the easiest to learn of any packet sniffer. It is based on a graphical interface with clearly arranged context menus and a simple layout. In addition, it provides a number of tools designed to improve its practical use, including the highlighting of network protocols in different colors and a detailed graphical representation of the output data. Unlike some more complex command-line applications (such as the tcpdump utility), the Wireshark interface is quite accessible to those who are just taking their first steps in the field of packet sniffing.
Cost. Wireshark is completely free as it is released under the GNU General Public License (GPL). It can be freely downloaded and used for any purpose: both personal and commercial.
Program support. The level of software support can decide its fate. Free software such as Wireshark may not have official support. So it’s not uncommon for the open source software community to rely on its user base to help out. Fortunately for us, the Wireshark development community is one of the most active. In particular, the links on the Wireshark website lead directly to several forms of support, including easily accessible documentation, wiki pages, FAQs, and a place to subscribe to a mailing list controlled by most of the core Wireshark developers. There is also paid support for Wireshark from Riverbed Technology.
Access to source code. Wireshark belongs to the category of open source software that is available at any time. This can be useful for debugging an application, understanding how network protocol decoders work, or helping Wireshark development.
Operating Systems. The Wireshark app supports all major modern operating systems, including Windows, Linux, and Mac 0S X. For a complete list of supported operating systems, visit the Wireshark website home page.
The Wireshark installation process is surprisingly simple. But before you install Wireshark, make sure your system meets the following requirements.
Any modern 32-bit or 64-bit x86 processor.
400MB of available RAM, although larger capture files require more memory.
At least ZOO MB of hard drive space plus room for capture files.
A network adapter that supports promiscuous intercourse.
WinPcap/libpcap interception driver.
The WinPcap capture driver is a Windows implementation of psar, the AP1 packet sniffing interface. Simply put, this driver communicates with the operating system to intercept outgoing packet data, apply filters, and switch the network adapter in and out of combined mode.
Although the WinPcap driver can be downloaded separately (at http://www.winpcap.org/), it is generally better to install it from the Wireshark distribution, since the version of the WinPcap driver included in this package has already been tested with Wireshark.
The current version of Wireshark has been tested to work on various versions of Windows that are still being tested by their manufacturer. As of this writing, supported versions include Windows Vista, Windows 7, Windows 8, Windows 10, and Windows Server 2003, 2008, and 2012. And while Wireshark often works on other versions of Windows (such as Windows XP), these versions are not officially supported.
To install Wireshark on Windows, you must first obtain the latest build of the installation package from the official Wireshark website at http://www.wireshark.org/. To do this, go to the Down10ad section of this website and select the installation package you want, depending on the version of Windows you are using.
And after downloading the installation package, follow the steps below.
Double-click the file with the extension . exe to start the installation, and then click Next in the welcome window.
Read the license agreement and, if you agree with it, click on the button I Adgay (agree).
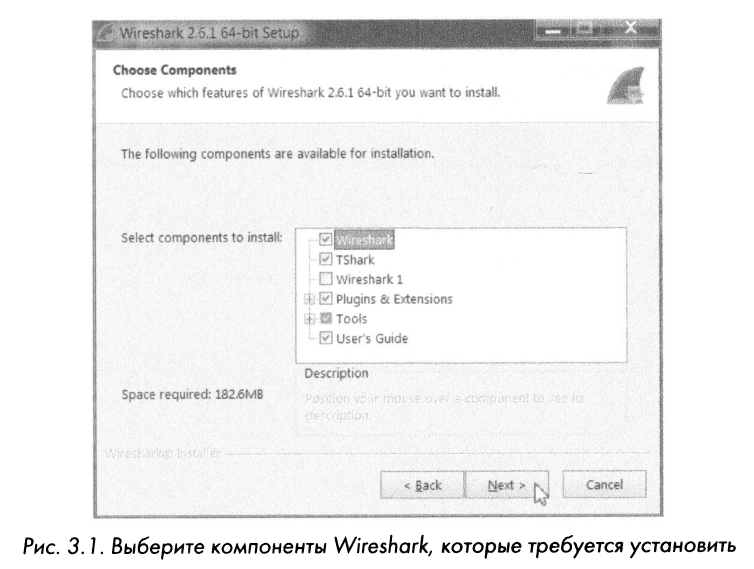
Select the Wireshark components you want to install, as shown in Fig. 3.1. For your purposes, you can accept the default components and click Next.
Click Next in the Select AdditionaI Tasks window.
Select the location where you want to install Wireshark and click Next.
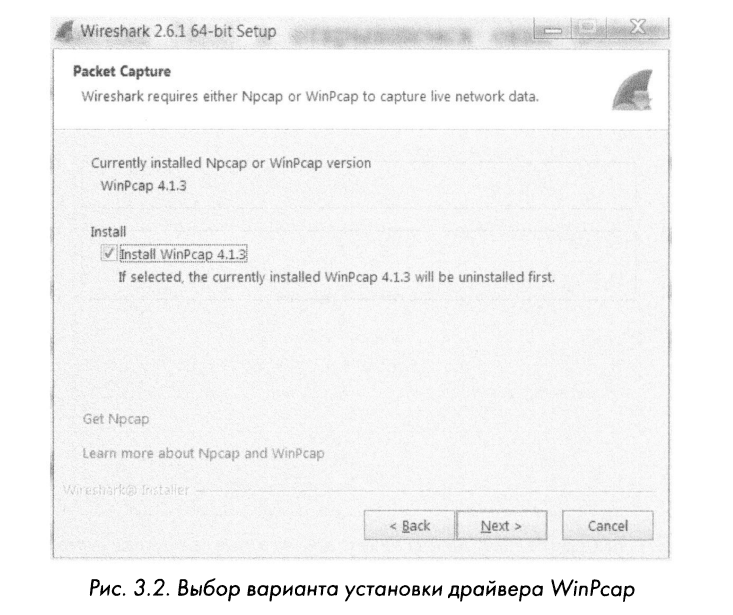
When a dialog box appears asking you to install the WinPcap driver, first check the lnstall WnPcap check box, as shown in Fig. 3.2, and then click on the LNSTall button. As a result, the installation process should begin.
Next, you will have the opportunity to install USBPcap – a utility for collecting data from Check the appropriate box if you want to install this tool, and then click on the Next button.
Somewhere in the middle of the Wireshark installation process, the installation of the WinPcap driver should begin. And as soon as this happens, click the Next button in the introductory window, read the license agreement, and if you agree with it, click the Adjay button.
As a result, the selected WinPc.ap driver and the USBPcap utility must be installed on the computer. When the installation is complete, click the Finish button.
This should complete the Wireshark installation. And once that happens, click Next.
Click Finish in the Wireshark installation confirmation window.
The Wireshark application works on most modern Unix-based platforms. You can install it using one of the distribution managers or by downloading and installing the distribution corresponding to your operating system. It would be unrealistic to cover all the installation procedures in every version of Linux, so let’s look at just a few of them.
As a rule, installing system software in the Unix OS requires superuser (root) access rights. But installing local versions of software compiled from source code does not require superuser rights.
If you’re using a Red Hat Linux version or a distribution based on it, such as CentOS, it probably has the Wit package management tool by default. In this case, to quickly install the Wireshark application, you just need to extract it from the software repository for the distribution. To do this, open a terminal window and enter the following command:
$ sudo yum install wireshark
If you need additional dependencies, you will be prompted to install them as well. If everything goes well, you can run Wireshark from the command line and access it through the GUI.
Systems based on DEB-nckeT0B
Most distributions based on DEB-nakeT0B, such as Debian or Ubuntu, include the ART package management tool. It allows you to install Wireshark from the OS software repository. To install Wireshark using this tool, open a terminal window and type the following command:
$ sudo apt-get install wireshark wireshark-qt
And in this case, you will be prompted to install any dependencies to complete the installation process.
Due to changes in the architecture of the operating system and the functionality of Wireshark, the instructions for compiling the Wireshark source code may change over time. And this is one of the reasons why it is recommended to use the package manager of the operating system to install this application. However, if your Linux distribution does not use automatic package management software, or if you require a custom installation of Wireshark, you have the option of installing the program manually by compiling its source code.
To do this, do the following:
1. Download the source package from the relevant Wireshark website page at the above address.
2. Unzip the archive by entering the following command and substituting the appropriate file name of the downloaded package into it:
$ tar -jxvf <.vхажи!l'е .эдесъ JllIOI файла паже!l'а>. tar. bz2
3. Before choosing a configuration and installing Wireshark, you may need to install a number of additional packages depending on the Linux version you choose. For example, Ubuntu 14.04 requires the installation of a number of additional packages for Wireshark to work properly. And you can do it with the command below. But this will require superuser privileges, otherwise you will have to enter the sudo command first.
$ sudo apt-qet install pkg-config bison flex qtS-default liЬgtk-3-dev
liЬpcap-dev qttoolsS-dev-tools
4. After installing the necessary additional packages, change to the directory where you extracted the Wireshark source files.
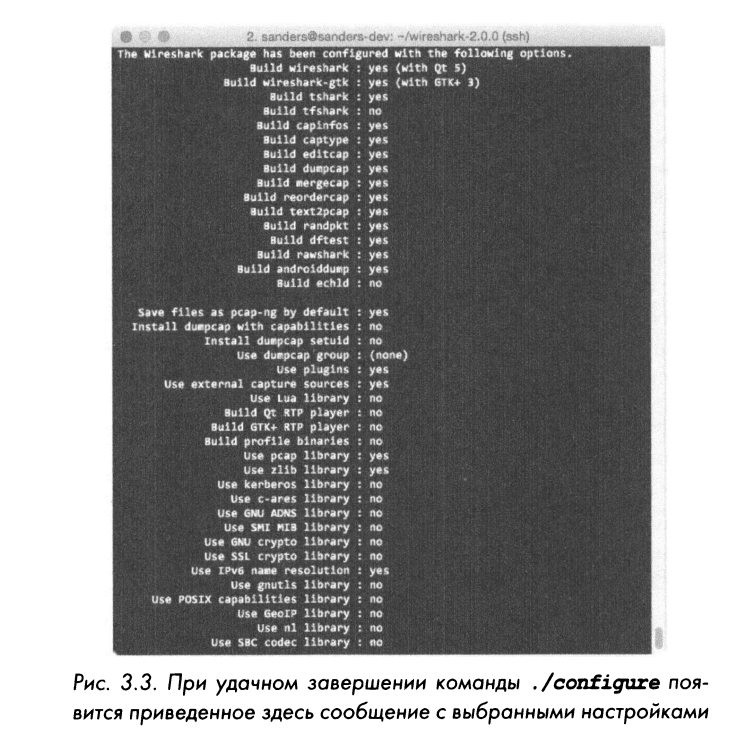
5. Adjust the source code to build correctly on your Linux distribution using the command. /Set up. If you want to change the default installation options, specify them at this stage of the installation. If any dependencies (ie, additional packages) are missing, the source code compilation will most likely fail. So install and configure the ambiguities dependencies before proceeding. And if the setup is successful, you will see a message notifying you about it, as shown in Fig. 3.3.
6. Enter the command to compile the source code and build the binary executable.
7. Run the final stage of the installation from the command sudo Nke install.
8. Run sudo /sbin/ldconfig to complete the process
To install Wireshark on one of your Mac 0S X systems, follow these steps:
Download the installation package for Mac 0S X from the relevant Wireshark website page at the above address.
Run the setup wizard and follow the instructions. After accepting the end user license terms, choose where you want to install Wireshark.
Complete the process. installation in the corresponding wizard.
Once you have successfully installed Wireshark on your system, you can start learning about it. When you open a fully functional bag sanitizer, you won’t see anything interesting! And the fact is that Wireshark needs some data to analyze the packets.
The first capture of the package
In order to enter packet data into Wireshark, you will have to sniff the packet first. And here you may have the following question: “How to intercept packets if everything is fine in my network?”
First, there is always something wrong with the Internet. If you don’t believe me, send an email to everyone on the network letting them know everything is working perfectly. Second, packet analysis does not necessarily require that there is something wrong with the network. In fact, packet analysts spend most of their working time analyzing healthy network traffic rather than problematic network traffic. After all, it is necessary to have some initial base for comparison in order to effectively adjust network traffic. For example, if you hope to solve a DHCP problem by analyzing its traffic, you need to know what the DHCP operational traffic flow looks like.
More broadly, finding anomalies in the day-to-day operation of a network requires knowing what that day-to-day operation looks like. If your network is running smoothly, your network observations will be a starting point for representing network traffic in a healthy state.
So, capture some packages by doing the following:
Open Wireshark.
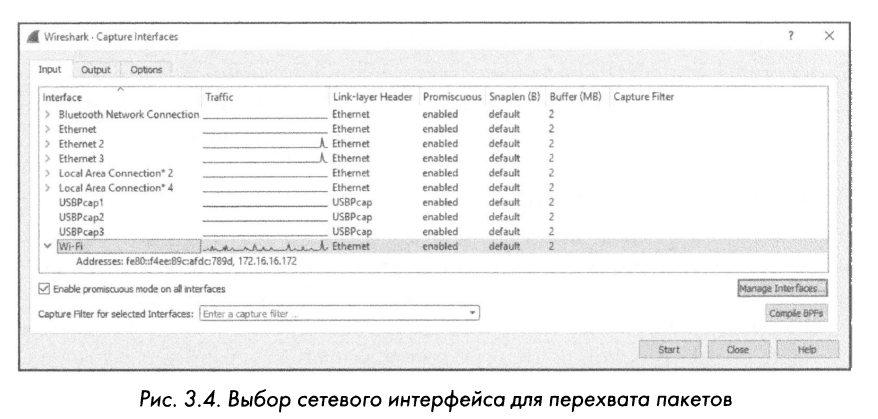
Select Capture40options from the main menu. As a result, a dialog box should appear, which lists the various network interfaces that can be used to intercept packets, as well as the most basic information about each of them (Figure 3.4). Look at the Traffc column, which shows a line graph illustrating the amount of network traffic currently passing through that interface. The spikes in this graph actually indicate packet sniffing. If they are missing, the line graph should be flat. Additionally, each interface can be expanded by clicking the arrow to the left of it to see its associated addressing information, such as MAC address or IP address.
First, select the desired network interface and click the Start button. The current window should be filled with intercepted data.
Wait about a minute, and once you’re ready to stop the capture and view the captured data, click the Stop button selected from the Capture drop-down menu.
Once you’ve completed the above steps, completing the capture process, Wireshark’s main window should populate with the captured data. In fact, the amount of this data may overwhelm you, but it will quickly make sense to you once you learn to dissect the contents of Wireshark’s main window piece by piece.
Most of the time you will have to work in the main Wireshark window. Here, intercepted packets are displayed and converted into 60 lei format, which is easy to analyze. So, let’s examine the contents of Wireshark’s main window using the capture we just made, as shown in Fig. 3.5.
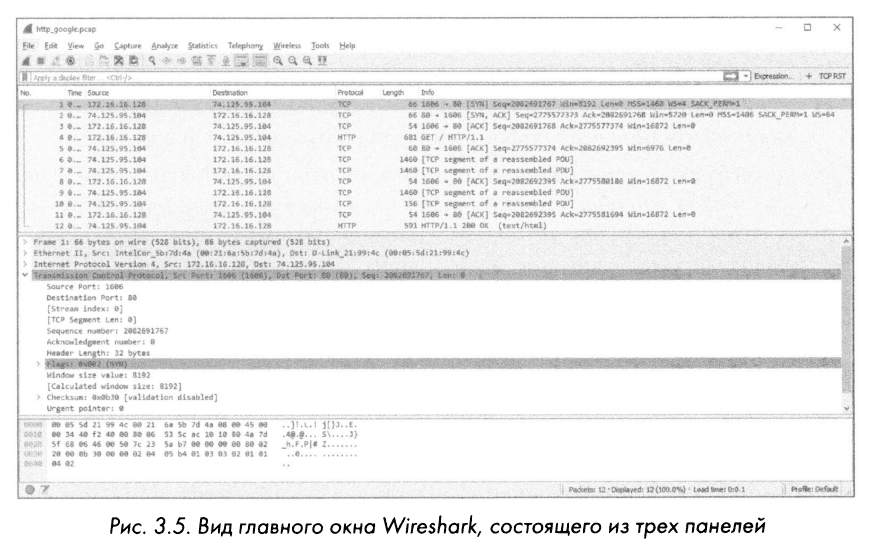
The main Wireshark window consists of the Packet List, Packet Details, and Packet Bytes panels, which are arranged from top to bottom and depend on each other. To view the details of an individual package in the Package Details panel, you must first select the package in the Package List panel. If you highlight part of a packet in the Packet Details panel, the individual bytes corresponding to that part of the packet appear in the Packet Bytes panel.
NOTE: In fig. 3.5 Note that the Packet List panel lists various network protocols. there is no visual division of protocols into different levels, except for highlighting them in different colors. Moreover, all packets are displayed in the order in which they are received on the network.
Below is a brief description of each panel.
List of packages. This is the top area that displays a table that contains all the packages from the current hook file. It consists of columns that contain the packet number, the relative time the packet was intercepted, the source and destination addresses of the packet, the network protocol type of the packet, and some general information contained in the packet.
NOTE: Hereafter, network traffic refers to all packets displayed in the Packet List panel. And if we are talking only about DNS traffic, then we mean packets using the DNS (Domain Name Service) protocol, which are sent in the same panel.
Package details. This is the middle area where information about a single package is displayed in a hierarchical way. It can be collapsed or expanded to display all the collected information about a particular package.
Packet bytes. This is the bottom panel, which displays the raw data of the packet, that is, the form in which the packet is transmitted over the network. This raw data does not contain anything that would make it easy to track. Methods for interpreting them are discussed in more detail in Appendix B, “Packet Interpretation,” of this book.
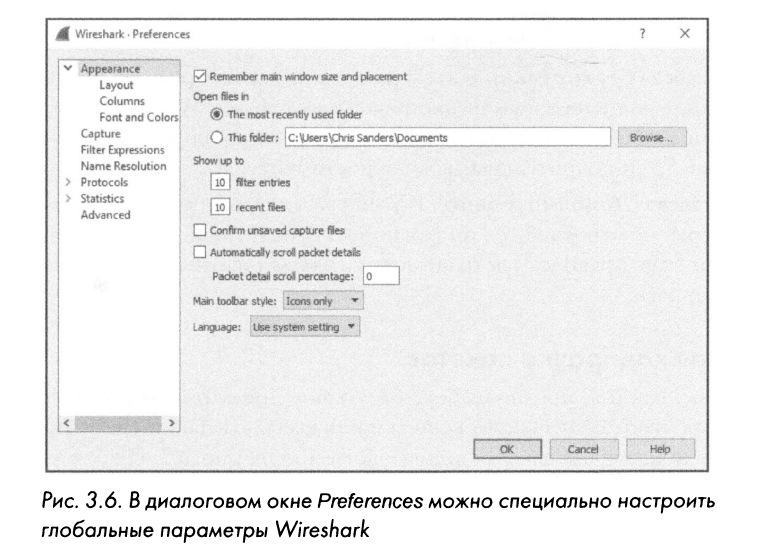
There are several global Wireshark settings that you can customize to suit your needs. To access Wireshark’s global preferences, select Edit4Preferences from the main menu. As a result, the Preferences dialog box will open with several custom settings, as shown in Fig. 3.6. Wireshark’s global configuration options are divided into six main sections and an additional Advanced section.
Below is a brief description of these topics.
Arreagapse (performance). This section contains global options that determine the order in which Wireshark displays data. Most of these settings can be changed based on your personal preferences, including the need to keep the window layout, the layout of the three main panels, the location of the scrollbar and columns in the Package List panel, the fonts that highlight intercepted data, and the colors of the background and font symbols .
Delight. This section contains global settings that determine the order in which packets are captured, including the default packet capture interface, whether to switch to combo mode by default, and whether to update the Packet List panel in real time.
FiIter expressions. Next, we’ll discuss how Wireshark can filter network traffic based on individual criteria. And in this section there are global settings that allow you to create and manipulate network traffic filters.
Resolution name. Using the global settings in this section, you can enable Wireshark’s functionality to translate addresses into more meaningful names, including link, network, and transport layer addresses, and specify the maximum number of simultaneous requests for name resolution.
Protocols. This section collects global settings related to the capture and display of various packets that Wireshark is able to decode. Customizable global settings are not available for all network protocols, but you can still change settings for some of them. However, it is best to leave these settings at their defaults unless there is a specific reason to change them.
Statistics. This section contains a number of global settings for configuring Wireshark’s statistical functions, discussed in more detail in Chapter 5, “Improving Wireshark”
Additionally. This section contains global settings that do not belong to any of the categories listed above. These are usually configured only by advanced Wireshark users.
If, like me, you prefer shiny objects and pleasant colors, then you will surely be interested in the ability to highlight packets in different colors in the Packet List panel, as shown in Fig. 3.7. And although this is only a black and white picture in the printed edition, the different shades of gray on it give a general idea of the color coding of the packages. At first glance, it may seem that the packages are highlighted with colors arbitrarily, but in fact this is not the case.
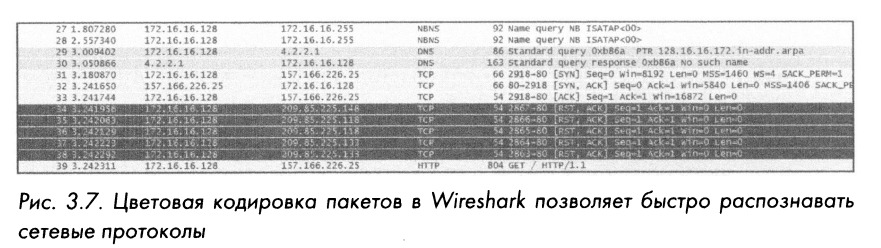
Each packet is displayed in a different color for a very good reason: the color can reflect the network protocol and values in individual fields of the packet. For example, all UDP traffic is highlighted in blue by default, and all HTTP traffic is highlighted in light green. This color coding allows you to quickly identify different network protocols without having to refer to the protocol field in each packet displayed in the Packet List panel. Over time, you’ll see for yourself how much time it saves you from browsing through large capture files.
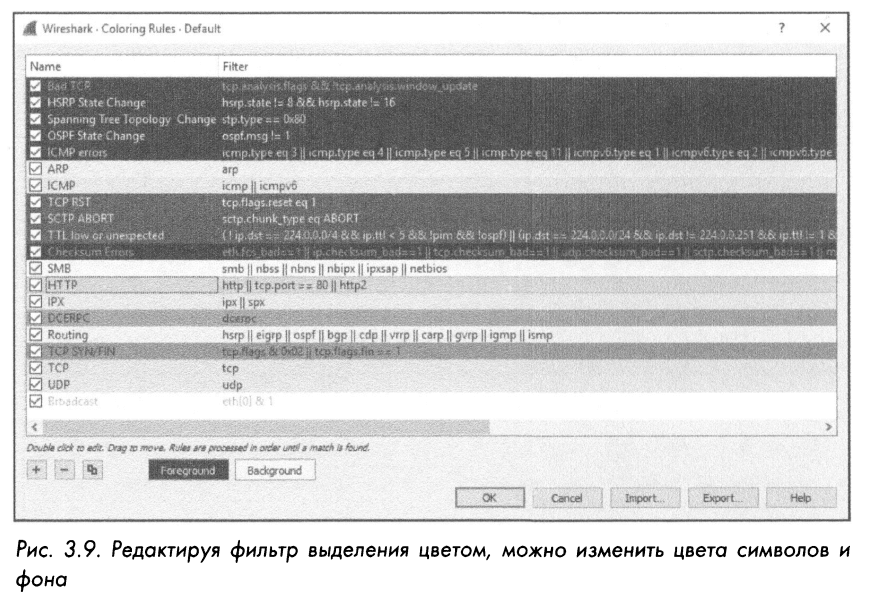
It is easy to change the colors assigned to each network protocol in the Color Rules dialog box, as shown in Figure II. 3.8. To open this window, select the Vtew4Coloring Rules command from the main menu.
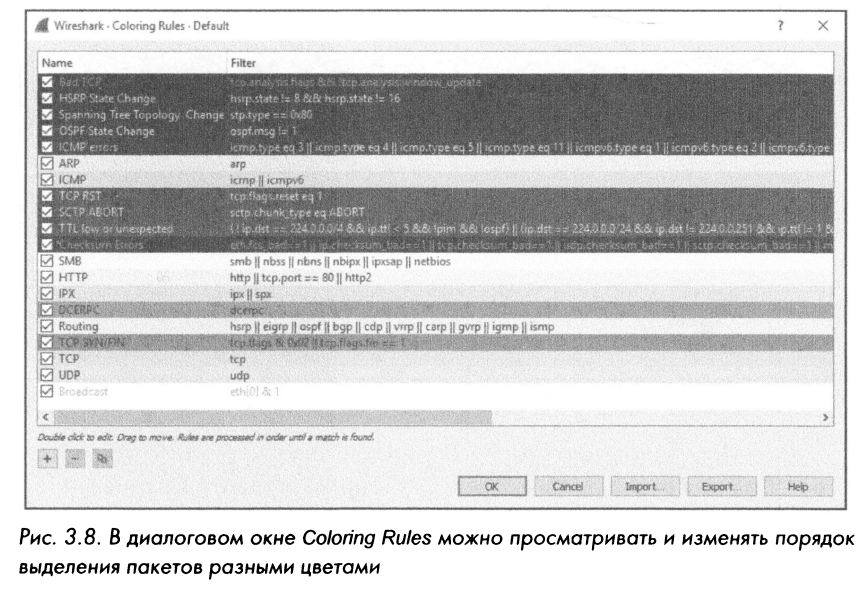
The coloring rules are based on the filters used in Wireshark and are discussed in more detail in Chapter 4, “Processing Captured Packets”. With the help of these filters, you can define your own coloring rules or change existing ones. For example, to change from a light green to a pale purple background color that highlights network traffic using the HTTP protocol, do the following:
Open Wireshark, and then open the Coloring Rules dialog box (using the View Coloring Rules command).
Find the HTTP network protocol color coding rule in the list of similar rules and select it by clicking on it.
At the bottom of the screen, you will see buttons for choosing the colors of symbols and backgrounds, as shown in Fig. 3.9.
Click the Background button.
Select the desired color from the color palette and click the “OK” button.
Click OK again to accept the changes and return to the main window. As a result, the user interface must reload to reflect the updated color scheme.
As you work with your network in Wireshark, you will gradually begin to notice that you have to deal with some network protocols more often than others. This is where color coding of packages comes to the rescue, which simplifies their analysis. For example, if you think you have a rogue DHCP-cepBep on your network that is randomly assigning IP addresses, you can change the color rules of the DHCP network protocol so that the relevant packets are displayed in light yellow or any other easily visible color. This will give you the opportunity to distinguish the weight of network traffic on DHCP much faster, which means that it will increase the effectiveness of packet sniffing.
It’s useful to know exactly where Wireshark stores its configuration settings in case you need to make direct adjustments to them. To find the location of the Wireshark configuration files, simply first select the Help4About Wireshark command and then go to the Folders tab. A dialog box with this expanded tab is shown in Fig. Q. 10.
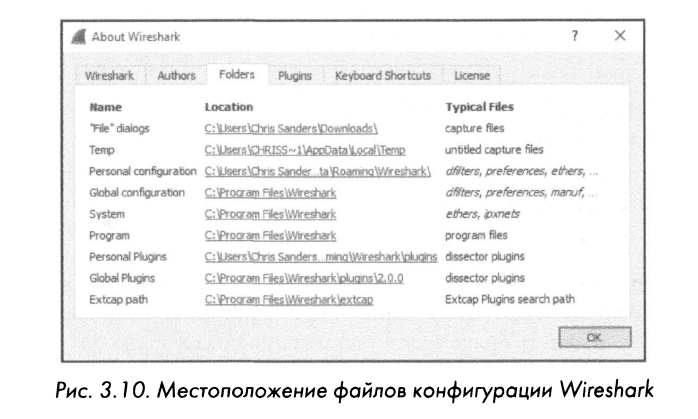
When it comes to custom Wireshark settings, the two most important places to do this are the personal and global configuration logs. For example, the global configuration directory contains all of Wireshark’s standard settings and profiles, while the personal configuration directory contains specific settings and profiles specific to your account. Any new files you create will be stored in a subdirectory located in your personal configuration directory with the names you specify. It is important to distinguish between personal and global configuration directories, as any changes to the global configuration files will affect every Wireshark user on the system.
After familiarizing yourself with Wireshark’s global settings, you may sometimes want to use one of these options first and then quickly switch to other global settings to adapt to the changed situation. But instead of having to reconfigure global settings every time you need to, you can take advantage of Wireshark’s built-in configuration profiles, which allow users to create and save a specific set of global settings.
A configuration profile stores the following:
Global settings
Interception filters
Display filters
Coloring rules
Prohibited network protocols
Force decryption Recent installations, including panel sizes, menu view options, and column widths
Protocol-specific tables containing, for example, a list of SNMP network users and special HTTP headers
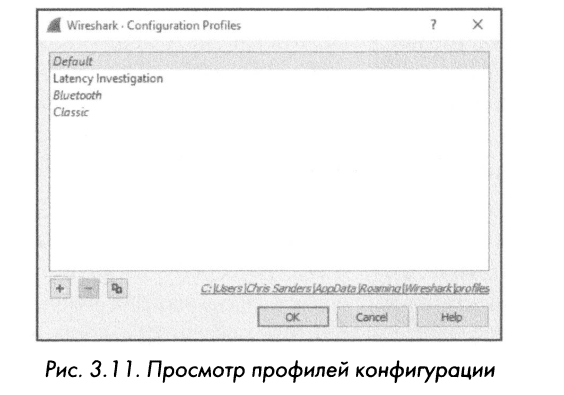
To view a list of configuration profiles, click Edit4Confguration Profiles from the main menu. You can also right-click on the profiles section in the lower-right corner of the window and select Mapade Profles from the context menu. In the Confguration Profiles window, you will find a number of standard Wireshark profiles, including the following: Defau1t (Standard), B1uetooth (Bluetooth Personal Wireless Network), and Classic (Classic). There is also a Latency Investigation profile specially created by the author of the book, which is highlighted in plain text, while the main profiles are highlighted in italics, as shown in Fig. 3. 11.
In the Configuration Profiles window, you can create, copy, delete, and apply configuration profiles. The process of creating a new profile is quite simple.
To do this, it is enough to perform the following actions:
Configure Wireshark with the settings you want to save in a separate profile.
Access the Configuration Profiles window by selecting Edit4Configuration Profiles from the main menu.
Click the plus (+) button and give the new configuration profile a descriptive name.
Click. on the OK button.
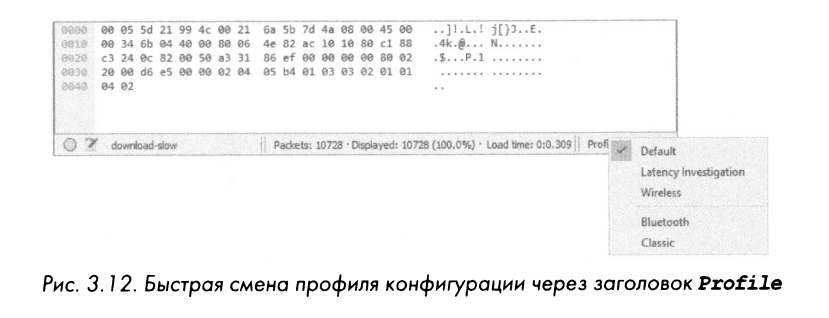
When you need to change a configuration profile, go to the Configuration Profiles window, click first on the name of the desired profile, and then click the OK button. This operation can be accelerated by right-clicking in the lower right corner of the Wireshark window on the Profi1e cap and selecting the desired profile, as shown in Fig. 3.12.
One of the most useful features of configuration profiles is the ability to store them in a separate directory along with a number of configuration files. This means you can back up your profiles and then share them with other users. On the Folders tab shown in fig. H. 10, the paths to directories with personal and global configuration files are specified. To exchange a profile with a user on another computer, simply copy the folder that matches the name of the profile being exchanged and paste it into the same directory for the corresponding user on the other computer.
As you read this book, you may need to create several high-level profiles for general network diagnostics, identifying the source of network latency, and investigating security issues. Don’t be afraid to use profiles freely. They really save time when you need to quickly change a number of global settings. I know Wireshark users who have used dozens of profiles to successfully solve a wide variety of network situations.
So, once you’ve installed and configured Wireshark, you’re ready to start analyzing packets. Chapter 4, “Handling Intercepted Packets,” explains how to handle intercepted packets.
We used materials from the book “PRACTICAL RACKET ANALYSIS” written by Chris Sanders.