29.10.2026
30 min
345



Every program running in Linux operates as one or more processes managed by the operating system kernel. The stability of servers, applications, and system services depends on how efficiently CPU time, RAM, and other resources are allocated. In the fourth and final part of the “Linux for DevOps and DevSecOps” series, we will explore the process lifecycle, PID and PPID, signals, process states, the /proc filesystem, the Linux scheduler, priority management, OOM Killer and cgroups mechanisms, as well as tools for system monitoring and diagnostics.
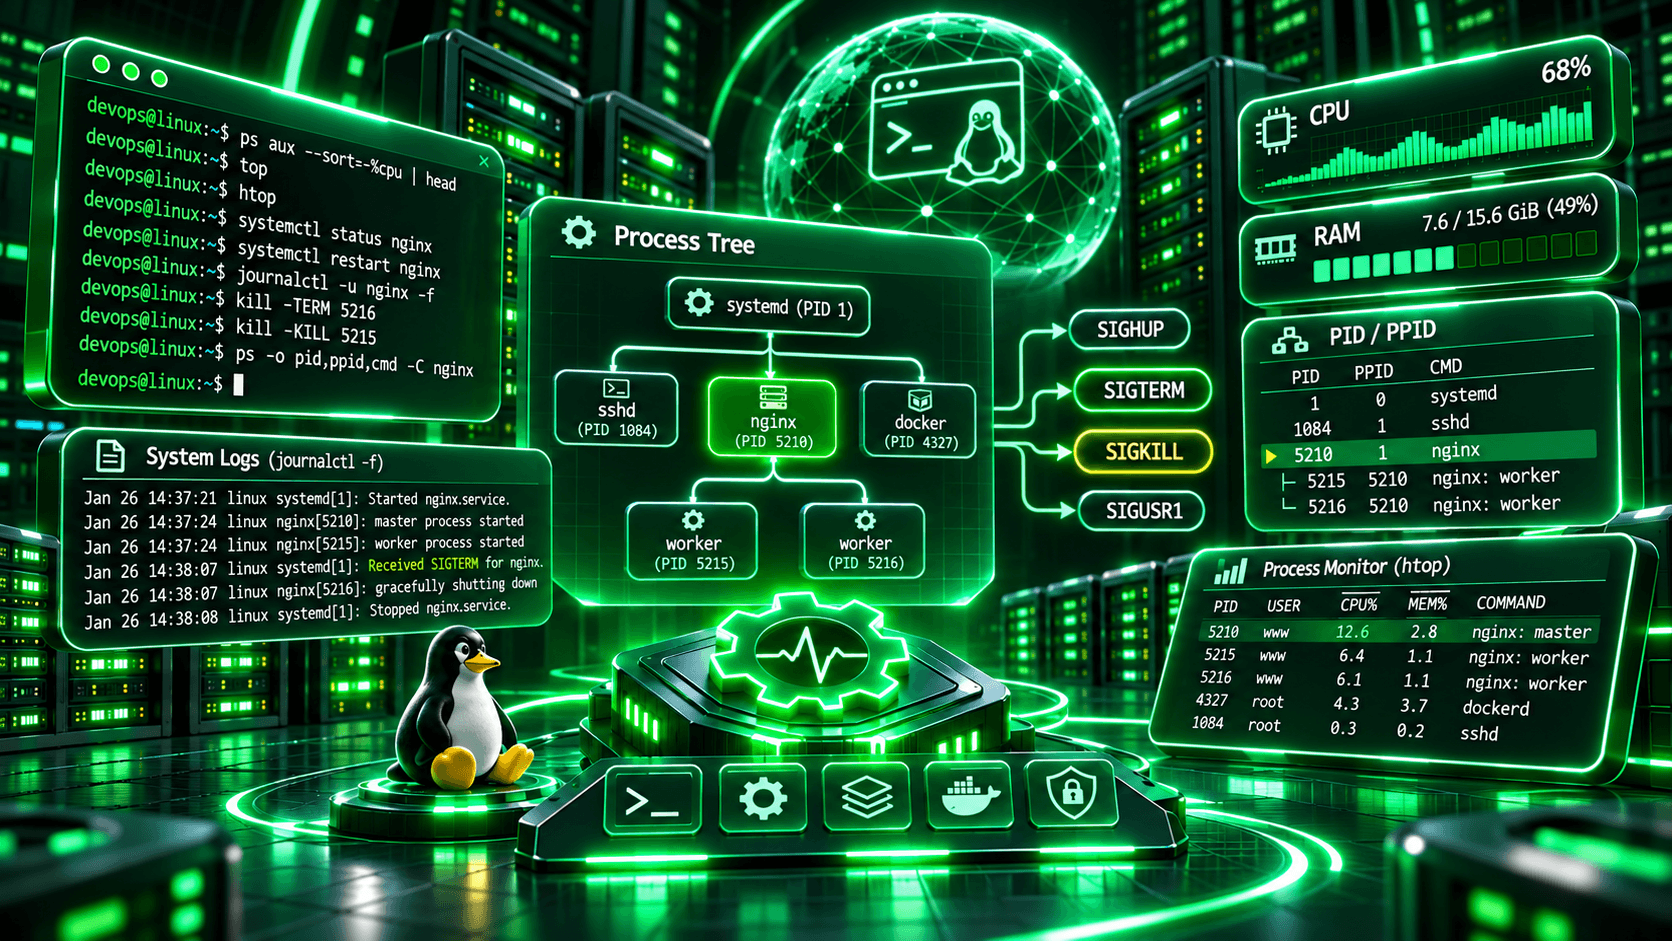
In the previous parts of this series, we covered the Linux filesystem, terminal navigation, user and group management, and access control mechanisms. Now, we will move on to processes, which perform the actual work within the operating system. They handle network requests, run web applications, execute automated tasks, interact with databases, and keep system services running.
For DevOps engineers, understanding processes is essential for diagnosing system load, troubleshooting unresponsive applications, managing services, and configuring resource limits. For DevSecOps specialists, this knowledge also helps analyze suspicious activity, identify the origin of unknown processes, examine their privileges, and detect unusual system behavior.
In this part, we will explore not only the essential commands but also the mechanisms behind them. We will examine how Linux creates processes, why they transition between different states, how the kernel allocates resources, and what happens when available RAM becomes insufficient. For hands-on experiments, we recommend using a separate virtual machine running Ubuntu or Debian to avoid affecting your primary environment.
A process is an instance of a program executing under the control of the operating system. While a program is stored on disk, it remains a collection of instructions and data. When a user or another process launches it, the Linux kernel establishes the necessary execution environment, assigns identifiers, and configures memory and other resources.
For example, when an administrator runs python3 app.py, the system creates a Python interpreter process that executes the code in the specified file. Nginx, PostgreSQL, SSH servers, and most other applications work in a similar way. Even the Bash command shell is a process that can create child processes to execute commands.
Each process has a set of attributes that determine its behavior and interaction with the operating system. The most important ones include:
| Attribute | Appointment |
|---|---|
| PID | Unique process identifier within the corresponding PID namespace |
| PPID | Parent process identifier |
| UID / GID | User and group identifiers |
| CWD | Current working directory |
| Environment | Environment variables |
| File Descriptors | Open files, sockets, and other resources |
| Memory | Virtual address space |
| State | Current execution status |
| Priority | CPU scheduling parameters |
A process has its own virtual address space, which isolates its memory from that of other processes. However, this does not mean that every process necessarily receives a separate physical region of RAM for all its data. The kernel uses virtual memory mechanisms, shared libraries, memory-mapped files, and other optimizations to manage memory efficiently.
Processes use file descriptors to interact with files and network connections. When a command-line program starts, three standard file descriptors are typically available: 0 for standard input, 1 for standard output, and 2 for standard error. However, the exact environment depends on how the program is launched, and some descriptors may be redirected or closed.
For example, when a command writes its output to a file using >, the shell configures the corresponding redirection. When an application establishes a TCP connection, it receives a socket descriptor through which it can exchange data.
Another important aspect of a process is its environment variables. These allow a process to receive configuration settings, directory paths, locale settings, and other information. For example, PATH specifies the directories searched for executable programs, HOME identifies the user’s home directory, and LANG controls language and regional settings.
However, environment variables may sometimes contain sensitive information, such as tokens, passwords, or access keys for external services. Therefore, they should be considered when analyzing process security, and care should be taken to prevent sensitive values from being accidentally exposed in logs.
In addition to processes, Linux supports threads of execution. Threads allow a single program to handle multiple tasks concurrently or in parallel, depending on the number of available CPU cores and the behavior of the scheduler.
For example, a web server may use multiple threads to handle different requests. These threads can share the same address space, open file descriptors, and other process resources. However, each thread has its own execution state, stack, and certain individual attributes.
In Linux, threads are implemented using kernel mechanisms closely related to process creation. Each thread has its own TID (Thread ID), while all threads belonging to the same process typically share a thread group identified by a single TGID (Thread Group ID), which user-space utilities often display as the process PID.
To view threads, you can use:
ps -eLf
Or run `top` in a mode that displays individual threads:
top -H
For DevOps engineers, this is important when analyzing multithreaded applications. If a single process uses multiple CPU cores or creates an excessive number of threads, it is essential to understand which tasks are running within it and how they affect the overall system load.
The lifecycle of a process begins when it is created and ends once the kernel and its parent process have completed the necessary steps to release resources and retrieve its exit status.
In the traditional Unix model, a new process is created using the fork() system call. This creates a child process that initially inherits certain characteristics from its parent. It is often followed by a system call from the exec family, which replaces the process’s executable image with a new program.
Modern Linux also provides clone() and clone3(), which offer more precise control over which resources are shared between tasks. These mechanisms are used, among other things, to implement threads and namespaces.
Imagine a user opens Bash and executes the following command:
sleep 120
The shell initiates the `sleep` program, which will wait for 120 seconds. A corresponding process is created for this, and Bash typically waits for it to finish if the command is run in the standard foreground mode.
If the `&` symbol is added, the process will be launched as a background job of the shell:
sleep 120 &
Now Bash will allow you to enter new commands without waiting for `sleep` to finish.
You can view current background tasks using the following command:
jobs -l
To bring a job back to the foreground, use fg. The bg command allows you to resume a suspended job in the background.
It is important to distinguish between background shell jobs and actual system services. A process started using & will not necessarily continue running after the terminal is closed. For long-running server applications, dedicated service managers such as systemd are typically used.
When a program finishes executing, it returns an exit status to the system. By convention, a value of 0 indicates success, while nonzero values often indicate an error or another outcome that requires attention.
In Bash, the exit status of the most recently completed command is available through $?:
true
echo $?

false
echo $?
The first command will typically exit with code 0, while the second will exit with code 1. This is particularly important for automation. Deployment scripts, application health checks, and CI/CD pipelines often rely on exit codes to determine whether an operation was successful.
When a process terminates, the kernel releases most of its resources but temporarily retains the information needed by its parent process to retrieve its exit status. This is handled through system calls from the wait() family.
If the parent process has not yet retrieved this information, the terminated child process may remain in a zombie state. Such a process no longer executes code or consumes CPU time, but its entry remains in the kernel’s process tables.
A few short-lived zombie processes do not necessarily indicate a problem. Issues arise when they accumulate because of bugs in the parent program that prevent it from properly handling the termination of child processes.
You can check for zombie processes using the following command:
ps -eo pid,ppid,stat,comm | awk '$3 ~ /^Z/'
Here, we use ps to retrieve information about processes and awk to filter entries with the Z state.
It is important to understand that a zombie process cannot be terminated with a regular signal because it has already finished executing. Instead, you need to investigate the parent process that has not collected its exit status. If the parent terminates, orphaned child processes are adopted by an appropriate process, such as PID 1 or a configured subreaper, which can perform the necessary wait() operation.
Every process in Linux is assigned a numerical identifier called a PID (Process ID). It is used to identify the process, send signals, check its state, and perform other management operations.
PPID (Parent Process ID) identifies the parent process. This allows Linux to maintain a process hierarchy, making it possible to trace which program launched another.
To display a list of all processes, use the following command:
ps -ef
For more convenient analysis, you can select only the necessary columns:
ps -eo pid,ppid,user,stat,comm
The PID, PPID, user, process state, and the short name of the program are displayed here.
To view the hierarchy as a tree, `pstree` is used:
pstree -p
On a typical server, you can see how services, user sessions, and their child processes branch off from the system manager.
A special place is occupied by PID 1. In many modern distributions, this is systemd, which starts at an early stage of boot and is responsible for managing system services. However, in other environments, PID 1 may belong to a different init system or a custom process, particularly inside a container.
You can check the process with PID 1 as follows:
ps -p 1 -o pid,ppid,comm,args
On a typical system using systemd, you will see the corresponding init system manager. It is also worth mentioning kthreadd, which often has PID 2 in the initial Linux PID namespace. It is responsible for creating kernel threads that perform internal system tasks. In process listings, these threads are often displayed in square brackets, such as [kworker/0:0].
Another important point is that a PID is not a permanent global identifier. After a process terminates, its PID may eventually be reused. Additionally, thanks to PID namespaces, the same process can have different identifiers inside a container and on the host system.
This should be taken into account when writing scripts that work with PIDs, especially if some time passes between identifying a process and performing an operation on it.

During its operation, a process may be executing code, waiting for data, suspended, or terminating. To represent these situations, Linux uses specific states, which can be seen in the `STAT` column of the `ps` command.
For example:
ps aux
As a result, each process will have a set of characteristics, including an execution state.
Key notations:
| State | Value | Description |
|---|---|---|
R |
Running | Executing or waiting for processor time |
S |
Interruptible Sleep | Anticipates an event and can respond to signals |
D |
Uninterruptible Sleep | Remains in a state of waiting that is not interrupted by ordinary signals |
T |
Stopped | Suspended by a control signal |
t |
Tracing Stop | Stopped during tracing |
Z |
Zombie | Completed, but status not yet retrieved by the parent process |
I |
Idle | State used for individual kernel threads |
Not every process in the S state is unresponsive or hung. In many cases, this is normal behavior: the program is waiting for a network connection, a timer, user input, or another event. A server may spend most of its time in a waiting state and only become active when new requests arrive.
The D state often attracts administrators’ attention, especially when a process remains in this state for an extended period. It may be associated with waiting for I/O operations, filesystems, or hardware devices. However, this state alone does not necessarily indicate a malfunction.
If a process does not respond to signals for a long time, you should investigate which operation it is waiting for. For example, the issue may be related to an unavailable network storage system, a slow disk, or a stalled operation within the kernel.
The STAT column may also contain additional characters. For example, s indicates a session leader, l represents a multithreaded process, < indicates high priority, N indicates low priority, and + means the process belongs to the foreground process group of the terminal.
To display only selected process attributes, run:
ps -eo pid,ppid,stat,%cpu,%mem,comm
This command allows you to quickly compare process states with their CPU and memory usage.
Signals are a mechanism that allows the kernel or other processes to notify a process about a specific event or request a particular action. For example, when a user presses Ctrl+C in the terminal, the active foreground process group typically receives the SIGINT signal. When an administrator wants to gracefully terminate a service, they can send SIGTERM. If a process does not respond to a normal termination request, SIGKILL may be used as a last resort.
A process can handle certain signals using custom signal handlers, ignore them, or follow the system’s default behavior. However, SIGKILL and SIGSTOP cannot be caught or ignored by a user-defined signal handler.
The most important signals are:
| Signal | A typical number in Linux | Appointment |
|---|---|---|
SIGTERM |
15 | Request to terminate the process |
SIGKILL |
9 | Forced termination |
SIGINT |
2 | Execution interruption |
SIGHUP |
1 | Change of terminal state or an action defined by the program |
SIGSTOP |
19 | Forced suspension |
SIGCONT |
18 | Resumption of performance |
SIGCHLD |
17 | Повідомлення про зміну стану дочірнього процесу |
The numbers for certain signals vary depending on the architecture, so it is often more convenient to use their symbolic names in scripts.
The `kill` command is used to send signals. Despite its name, it is designed not only for forced termination but also for sending other types of signals.
For example:
kill -TERM 1234
This will send a SIGTERM signal to the process with PID 1234. If the program has an appropriate handler, it can finish current operations, close connections, save necessary data, and exit gracefully.
If the process does not respond, you can use:
kill -KILL 1234
Or a concise notation:
kill -9 1234
However, SIGKILL should be used only as a last resort. It prevents the process from executing its standard cleanup code, which can lead to the loss of unsaved data, incomplete operations, or other issues.
Furthermore, even SIGKILL does not guarantee that a process will disappear immediately if it is in an uninterruptible wait state within the kernel.
To locate processes by name and send signals, you can use `pgrep` and `pkill`:
pgrep -a nginx
pkill -TERM -x nginx
The first command finds matching processes and displays their PIDs along with their command lines. The second sends SIGTERM to processes with the exact name nginx that the current user has permission to signal. On a production server, pkill should be used with particular caution, as a name match may affect multiple processes simultaneously.
It is also worth mentioning SIGHUP. Some daemons use this signal to reload their configuration, but this behavior is application-specific rather than a universal Linux rule. For example, Nginx supports reloading its configuration without completely stopping the server.
For system services, it is generally better to use dedicated management tools such as systemctl, as they take the service configuration and lifecycle into account.
In the first part of this series, we introduced the /proc directory as an important component of the Linux filesystem. Now, we will explore it in greater detail, as it is one of the most useful sources of information for process diagnostics.
/proc is a virtual filesystem called procfs, through which the kernel exposes information about processes and its own state. Most of its files are not stored on disk in the conventional sense; instead, their contents are generated by the kernel when accessed.
Each visible process typically has a directory named after its PID. For example, /proc/1 contains information about the process with PID 1, while /proc/self provides access to the directory of the process making the request. Inside a process directory, you can find information about its command line, memory usage, file descriptors, working directory, status, and other attributes.
The main files and paths include:
| The Path | Information |
|---|---|
/proc/PID/status |
Process state, UID, GID, memory, threads |
/proc/PID/cmdline |
Launch arguments |
/proc/PID/environ |
Environment variables |
/proc/PID/exe |
Link to the executable file |
/proc/PID/cwd |
Current working directory |
/proc/PID/fd/ |
Open file descriptors |
/proc/PID/limits |
Resource constraints |
/proc/PID/io |
I/O operation statistics |
/proc/PID/maps |
Virtual memory mapping |
/proc/PID/cgroup |
Membership in control groups |
For example, to check the basic characteristics of PID 1, you can execute:
grep -E '^(Name|State|Pid|PPid|Uid|VmRSS|Threads):' /proc/1/status
As a result, we will see the process name, its status, identifiers, memory usage, and the number of threads.
To view the command line:
tr '\0' ' ' < /proc/1/cmdline
Arguments in the `cmdline` file are typically separated by null bytes, so `tr` is used to convert them into spaces.
To find out which executable file is associated with a process, you can examine the symbolic link:
ls -l /proc/1/exe
Sometimes, after a program is updated, the symbolic link may contain the (deleted) marker. This means that the path to the executable no longer points to an existing filesystem entry, even though the process continues to use the executable image that was already loaded.
For DevOps engineers, this may indicate that a service has not yet been restarted after a software update. For DevSecOps specialists, it may also be worth investigating when analyzing unknown or suspicious processes, although this alone does not indicate a system compromise.
Every process can access files, sockets, pipes, and other resources through file descriptors. The number of file descriptors a process can use is limited by resource limits and the system’s available capabilities.
If an application continuously establishes new connections or opens files without properly closing them, it may eventually reach its configured limit.
In such cases, the following error may appear in the logs:
Too many open files
You can check the current process descriptors via /proc:
ls -l /proc/self/fd
For information about process limits:
cat /proc/self/limits
On a production server, you should check the application’s specific PID rather than `/proc/self`, since the latter refers to the process executing the current request.
You can also use `lsof`, which displays open files and other resources:
sudo lsof -p 1234
Here, 1234 is an example of a PID (process ID) that needs to be investigated. It is important to understand that a large number of open descriptors does not always indicate a leak. For high-load network services, thousands of active connections can be normal. The issue arises when there is an uncontrolled increase in the number of descriptors, or when the count does not correspond to the application’s actual requirements.

On a typical server, the number of processes and threads significantly exceeds the number of available CPU cores. Therefore, the kernel must decide which tasks receive CPU time, in what order, and with what priorities. This is handled by the Linux process scheduler. It aims to use CPU resources efficiently, maintain the responsiveness of interactive applications, and follow the configured scheduling policies.
Historically, standard scheduling for regular tasks in Linux was closely associated with CFS (Completely Fair Scheduler). Modern Linux kernels also use EEVDF (Earliest Eligible Virtual Deadline First), which is integrated into the fair scheduling framework. As a result, the exact scheduling behavior depends on the kernel version and the selected scheduling policy. For administrators, the key point is that the scheduler distributes CPU time among tasks based on their parameters, current system load, and scheduling rules.
One of the simplest ways to influence CPU time allocation is through the nice value. For regular processes, it ranges from -20 to 19. The lower the nice value, the higher the task’s relative weight under standard scheduling. Conversely, a higher nice value means a lower relative priority. A nice value of 0 is the default for many processes, although the exact settings may vary depending on how they are launched.
To start a program with a lower priority, use nice:
nice -n 10 sleep 120
This will create a `sleep` process with a `nice` value of 10. In real-world scenarios, this approach can be used for backups, batch data processing, indexing, or other secondary tasks that should not compete excessively with critical services.
To change the `nice` value of a process that is already running, use `renice`:
renice -n 15 -p 1234
Increasing priority—that is, setting a lower *nice* value—typically requires specific privileges, such as `CAP_SYS_NICE`, or permissions related to resource limits. Under a standard configuration, a regular user can only lower the priority of their own processes.
You can view *nice* values as follows:
ps -eo pid,ni,pri,%cpu,comm --sort=ni
It is important to note that `nice` does not reserve a CPU core, nor does it guarantee a specific percentage of CPU usage. It is merely a relative scheduling parameter used by the relevant policies.
For more complex tasks, Linux supports various scheduling policies. These define the rules by which processes compete for CPU time.
The main policies are:
| Policy | Appointment |
|---|---|
SCHED_OTHER |
Standard planning of routine processes |
SCHED_BATCH |
Batch processing tasks |
SCHED_IDLE |
Very low-priority background tasks |
SCHED_FIFO |
Real-time scheduling without conventional quantization |
SCHED_RR |
Real-time scheduling with time quanta |
SCHED_DEADLINE |
Planning based on specified time parameters |
`chrt` is used to view and configure policies.
For example, the policy of the current shell process can be checked as follows:
chrt -p $$
Here, $$ contains the PID of the current shell. For routine administration of most applications, standard scheduling and nice adjustments are sufficient. Real-time scheduling policies should be used with great caution, as incorrect settings can negatively affect system responsiveness.
Assigning high real-time priorities to programs that may perform lengthy computations without blocking or voluntarily yielding the CPU is particularly dangerous. Therefore, experiments with SCHED_FIFO, SCHED_RR, and SCHED_DEADLINE should only be conducted in a separate testing environment.
In addition to CPU resources, processes actively use the disk subsystem. Linux provides the ionice utility to influence the priority of input/output (I/O) operations.
For example:
ionice -c 3 sleep 120
Such a command launches a process with the I/O idle class. However, the actual effect depends on the I/O scheduler, the file system, the device, and kernel settings.
Another tool, `taskset`, allows you to view or modify CPU affinity—that is, the set of logical processors on which a process is permitted to execute.
For example, to view the current affinity of the shell:
taskset -cp $$
And to run a command on the first available logical CPU, you can use:
taskset -c 0 sleep 120
In this context, CPU 0 must be available within the relevant environment. Inside containers or systems with CPU restrictions, the set of available logical processors may differ.
CPU affinity can be useful for specialized workloads, performance testing, and specific low-latency scenarios. However, pinning a process to specific cores does not guarantee that other processes will not use those same cores.
RAM is a limited resource. When processes consume too much memory, the system may use swap, memory reclamation mechanisms, and other methods to free up resources. However, these measures are sometimes insufficient.
In such situations, the Linux kernel may activate the OOM Killer (Out-of-Memory Killer), which selects a process to terminate forcibly in order to free up memory and allow the system to continue operating.
The selection of a process depends on several factors, including its memory usage score, relevant system settings, and the scope in which the memory shortage occurs. The process consuming the most RAM is not necessarily the one that gets terminated.
Linux provides the oom_score and oom_score_adj values for analyzing and influencing this behavior. The former represents the current score that the kernel may consider when selecting a process to terminate, while the latter allows this score to be adjusted.
For example, to check the OOM-related parameters of the current shell:
cat /proc/$$/oom_score
cat /proc/$$/oom_score_adj
The oom_score_adj value can range from -1000 to 1000. Lower values reduce the likelihood of a process being selected for termination, while -1000 generally protects it from the kernel’s OOM victim selection mechanism.
However, modifying these parameters without understanding the consequences can be dangerous. Overprotecting a resource-intensive process may cause other, more critical system components to be terminated instead.
To check whether any OOM events have occurred, you can examine the kernel logs:
sudo journalctl -k --no-pager | grep -Ei 'out of memory|oom-kill|killed process'
The logs may contain messages indicating which process was terminated and what circumstances caused the memory shortage.
For DevOps engineers, this is important when investigating unexpected application restarts. If a service periodically disappears without any clear errors in its own logs, an OOM event may be the cause.
It is also important to consider cgroup OOM events, which occur when processes exceed the memory limit of their control group. In containerized environments, this can happen even when the host server still has free memory available.
Some Linux distributions also use systemd-oomd, which can terminate processes or control groups according to its own policies for responding to memory pressure. This mechanism operates separately from the kernel’s OOM Killer.
Linux allows you not only to monitor resource consumption but also to define limits on the resources available to individual processes and groups of processes.
Several mechanisms are available for this purpose. One of them is process resource limits, which can be viewed and modified from the command-line shell using ulimit.
For example:
ulimit -a
The command will display the current shell limits, including the number of open files, the maximum number of specific processes or threads, stack size, and other parameters.
To check the limit on open file descriptors:
ulimit -n
However, these limits have a specific scope. Changing ulimit affects the current shell and processes that inherit its settings. It does not automatically modify the limits of all applications that are already running.
For persistent settings in interactive sessions, PAM and configuration files such as /etc/security/limits.conf can be used. However, this mechanism does not always apply to services started through systemd.
Control Groups, or cgroups, are a Linux kernel mechanism that allows processes to be organized into groups and their resource usage to be controlled.
Unlike ulimit, which sets individual resource limits for processes, cgroups allow administrators to manage the resources consumed by entire groups of tasks, including child processes. This makes it possible to limit RAM consumption, CPU time, the number of tasks, and certain aspects of I/O operations.
This mechanism is widely used in containerization. When a memory or CPU limit is configured for a Docker container, the corresponding restrictions are typically enforced through cgroups. Modern Linux distributions increasingly use cgroup v2, which provides a unified resource hierarchy.
To display the control group hierarchy, use the following command:
systemd-cgls
And for interactive monitoring of their resource usage:
systemd-cgtop
If you need to determine which cgroup the current shell belongs to:
cat /proc/self/cgroup
For DevOps engineers, cgroups are particularly important because they allow resource usage to be controlled for logical groups of processes rather than individual PIDs. If an application creates ten or even a hundred child processes, the configured group-level resource limit will still apply to those tasks.
Most modern Linux server distributions use systemd to manage system services. It is responsible for starting, stopping, restarting, and monitoring many components of the operating system.
Unlike launching a regular program from the terminal, systemd allows administrators to define how a service should behave after a failure, which components it depends on during startup, and what resources it can access. The systemctl command is used to manage these services.
For example, to check the status of the SSH service on Ubuntu:
systemctl status ssh
On other distributions, the unit name may differ—for example, `sshd.service`.
To start the service:
sudo systemctl start ssh
To stop:
sudo systemctl stop ssh
To restart:
sudo systemctl restart ssh
Restarting SSH on a remote server can affect connectivity; therefore, before performing such operations, you should verify the configuration and ensure you have a way to restore access.
To configure automatic startup during system boot:
sudo systemctl enable ssh
And to verify the relevant setting:
systemctl is-enabled ssh
It is important to distinguish between enable and start. The first command configures the service to start according to the unit’s activation mechanism, while the second starts the service immediately. To perform both operations at once, you can use systemctl enable --now.
Systemd services are defined using unit files. Regular services typically use the .service extension and contain startup parameters, dependencies, restart policies, and resource limits.
For example, a sample service might have the following configuration:
[Unit]
Description=Linux Training Service
After=network.target

[Service]
Type=simple
User=nobody
ExecStart=/usr/bin/sleep infinity
Restart=on-failure
RestartSec=5
NoNewPrivileges=yes
PrivateTmp=yes
MemoryMax=128M
TasksMax=50

[Install]
WantedBy=multi-user.target
This example demonstrates the basic systemd parameters and is not intended for direct deployment in a production environment.
ExecStart specifies the command to execute, User defines the user account under which the service runs, and Restart controls the service’s behavior after termination. Meanwhile, MemoryMax and TasksMax set the corresponding resource limits.
The NoNewPrivileges=yes option prevents the process and its descendants from gaining additional privileges through program execution mechanisms. The PrivateTmp=yes option provides the service with an isolated view of temporary directories.
Systemd also provides additional security mechanisms that can restrict access to the filesystem, devices, networking capabilities, and system calls. However, these settings should be configured according to the application’s actual requirements to avoid unintentionally disrupting its operation.
To view the effective configuration parameters of a specific service, use:
systemctl show ssh.service
And for information regarding specific restrictions:
systemctl show ssh.service -p MemoryMax -p TasksMax -p CPUQuota
These tools are particularly useful when diagnosing applications that terminate after reaching a memory limit or are unable to spawn the required number of processes.
Systemd also integrates with the system journal, which can be viewed using `journalctl`.
To retrieve entries for a specific service:
sudo journalctl -u ssh.service
To view the last 50 messages:
sudo journalctl -u ssh.service -n 50 --no-pager
And to track new entries in real time:
sudo journalctl -u ssh.service -f
This is useful when you need to determine the cause of a startup error, check application messages, or analyze events that occurred before the application terminated.
For DevSecOps, service logs also help track unusual restarts, authentication errors, and other events that may be relevant during incident investigations.
When managing a server, it is important to identify processes that consume excessive resources, enter unusual states, or behave unexpectedly.
Linux provides several utilities for basic process monitoring. We have already used ps, which displays a snapshot of process information at the moment the command is executed. For monitoring changes in real time, top and htop are more convenient.
The top command displays current CPU usage, RAM consumption, the number of processes, and other system metrics.
top
By default, the information is updated periodically, allowing you to observe the load dynamically.
To update every second:
top -d 1
To track a specific process:
top -p 1234
Interactive keys are available within `top`. For example, `P` sorts processes by CPU usage, `M` by memory usage, and `q` exits the program.
For a more convenient interactive monitoring experience, `htop` is often used. It provides a color-coded view of system resources, allows for sorting and filtering processes, enables viewing the process tree, and lets you perform various actions without needing to memorize a large number of parameters.
On Ubuntu and Debian, it can be installed as follows:
sudo apt install htop
After installation:
htop
However, even convenient monitoring tools do not always immediately reveal the root cause of a problem. For instance, high CPU usage might be normal for a compute-intensive application, while low CPU usage combined with slow server performance can sometimes indicate that the system is waiting on disk I/O, network operations, or locks.
Therefore, when diagnosing issues, it is also advisable to use tools such as `free`, `vmstat`, `iostat`, `ss`, and others, depending on the nature of the problem.
For example:
free -h
Displays RAM and swap usage.
vmstat 1 5
Displays several consecutive snapshots of statistics regarding memory, CPU time, and I/O operations.
To check for network sockets awaiting connections:
sudo ss -lntp
This allows you to view listening TCP ports, their associated processes, and process IDs, provided the current user has sufficient permissions to access this information.
For DevSecOps specialists, this can help identify an unexpected service that has started listening on a network port. However, an open port alone does not indicate an attack. It is necessary to examine the process’s purpose, configuration, and expected system behavior.
To reinforce what we have learned, let’s create a simple background job and examine its attributes using standard Linux tools. All operations can be performed in a regular command-line shell without administrative privileges.
First, let’s start the sleep program in the background:
sleep 300 &
Bash will report the background job number and the PID of the launched process. To store the PID in a variable, we can do the following:
LAB_PID=$!
Now let’s check the information about the process:
ps -o pid,ppid,user,stat,ni,comm -p "$LAB_PID"
The command will display the PID, PPID, owner, status, nice value, and the short name of the program.
Next, let’s examine the data from /proc:
cat "/proc/$LAB_PID/status" | grep -E '^(Name|State|Pid|PPid|Uid|Threads):'
We will see the process characteristics generated by the Linux kernel.
Now, let’s check its priority:
ps -o pid,ni,pri,comm -p "$LAB_PID"
And we will lower the relative priority:
renice -n 10 -p "$LAB_PID"
After this, we will check the `nice` value again to ensure that the change has been applied.
The next step is to check the signals. First, we will pause the process:
kill -STOP "$LAB_PID"
Let’s check its condition:
ps -o pid,stat,comm -p "$LAB_PID"
Now, the STAT column should show the stopped state T.
Let’s resume execution:
kill -CONT "$LAB_PID"
And let’s check the status again:
ps -o pid,stat,comm -p "$LAB_PID"
Since `sleep` primarily waits for a specified duration to elapse, it will typically be in the S state upon resuming.
Finally, let’s terminate the process properly:
kill -TERM "$LAB_PID"
In the current shell, you can obtain its completion status:
wait "$LAB_PID"
echo $?
If the process was terminated by the SIGTERM signal, Bash will often report exit code 143, which corresponds to 128 + 15. However, the behavior and format of the messages depend on the shell and the specific circumstances of termination.
This example demonstrates nearly the entire basic process lifecycle: launching a process, obtaining its PID, checking its state, adjusting its nice value, suspending, resuming, and terminating it.
These mechanisms form the foundation of process management for many server applications. In a real-world environment, web servers, monitoring agents, data processing scripts, and system services may be running instead of sleep.

🔎 Viewing and Finding Processes
ps aux– Display processes with resource usage information.
ps -ef– View processes in an alternative format.
pstree -p– Display the process tree with PIDs.
pgrep -a nginx– Find processes by name.
pidof nginx– Get the PIDs of processes with the specified name.
jobs -l– View background jobs in the current shell.
⚙️ Managing Processes and Signals
kill -TERM PID– Send a termination request to a process.
kill -KILL PID– Forcefully terminate a process.
kill -STOP PID– Suspend a process.
kill -CONT PID– Resume a suspended process.
kill -l– List available signals.
pkill– Send a signal to processes matching specified criteria.
🧠 Priorities and Scheduling
nice -n 10 command– Start a command with a lower scheduling priority.
renice -n 15 -p PID– Change the nice value of a running process.
chrt -p PID– Check a process’s scheduling policy.
ionice -p PID– View a process’s I/O priority.
taskset -cp PID– Check a process’s CPU affinity.
📁 Investigating Processes Through /proc
cat /proc/PID/status– View a process’s state and attributes.
cat /proc/PID/limits– Check resource limits.
ls -l /proc/PID/fd– View open file descriptors.
cat /proc/PID/io– Retrieve I/O statistics.
cat /proc/PID/cgroup– Check a process’s cgroup membership.
📊 Monitoring and System Services
top– Monitor processes in real time.
htop– Use an interactive process monitor.
free -h– View RAM usage.
systemctl status– Check the status of a system service.
journalctl -u– View logs for a specific service.
systemd-cgls– Display the control group hierarchy.
systemd-cgtop– Monitor resource usage across cgroups.
ulimit -a– View the current shell’s resource limits.
Processes are fundamental to how Linux operates. They allow the operating system to execute programs, handle requests, manage services, and utilize hardware resources. Understanding their lifecycle, states, and interactions with the kernel makes it possible not only to administer servers more effectively but also to identify the causes of failures and performance issues more quickly.
In the fourth part of this series, we explored process creation and termination, process identifiers, signals, the /proc filesystem, the Linux scheduler, and priority management tools. We also examined OOM Killer, resource limits, cgroups, systemd services, and practical process monitoring techniques.
For DevOps engineers, this knowledge helps maintain server infrastructure stability, allocate resources efficiently, and automate application management. For DevSecOps specialists, it is essential for analyzing suspicious processes, examining privileges, investigating security incidents, and maintaining a secure operating environment.
This concludes our four-part “Linux for DevOps and DevSecOps” series. We have covered everything from the Linux filesystem and essential commands to user management, file permissions, and process control. These fundamentals provide a solid foundation for working with Linux servers, containerization, infrastructure automation, and practical cybersecurity.