
12.11.2025
15 min
720

BloodHound is one of the most user-friendly Active Directory analysis tools that helps you spot risky connections and weak settings in your domain. Improved data handling, new visualization capabilities, and additional analysis scenarios make it even more useful for both security professionals and beginners. This article explains what improvements help you see more problems in AD and simplify your work with the tool.

Typically, an Active Directory-based domain has a significant number of objects, properties, and relationships between them. In general, “manually” identifying flaws in the domain configuration and building a probable attack vector based on them is a rather laborious task and it is impossible to cope with it without auxiliary software tools.
This material will provide an overview of some software tools used for automated construction of possible attacks in the domain. In addition, some approaches to improving existing solutions will be considered, and our own algorithm for identifying the highest priority attack targets will be proposed.
It is important that the material is designed for a reader who has experience in Active Directory penetration testing.
At the time of writing, there are many tools available in the public domain to analyze Active Directory configuration vulnerabilities. For example:
Roughly speaking, the principle of operation of the tools is to collect information about the LDAP protocol domain under investigation. As a rule, the tools contain a number of typical queries that check for the presence of a certain flaw or dangerous configuration. The answers received are then provided for analysis by a specialist.
The collected results can be presented in an interactive form (BloodHound, Adalanche, Jackdaw). In this case, the tool has a graphical shell to a certain database with the ability to perform clarifying queries by the specialist.
Another way to present the results is a static report generated (PingCastle, Purple Knight).
There is a well-founded opinion that those who defend themselves think in lists, and attackers think in graphs, and so far – the latter will win.
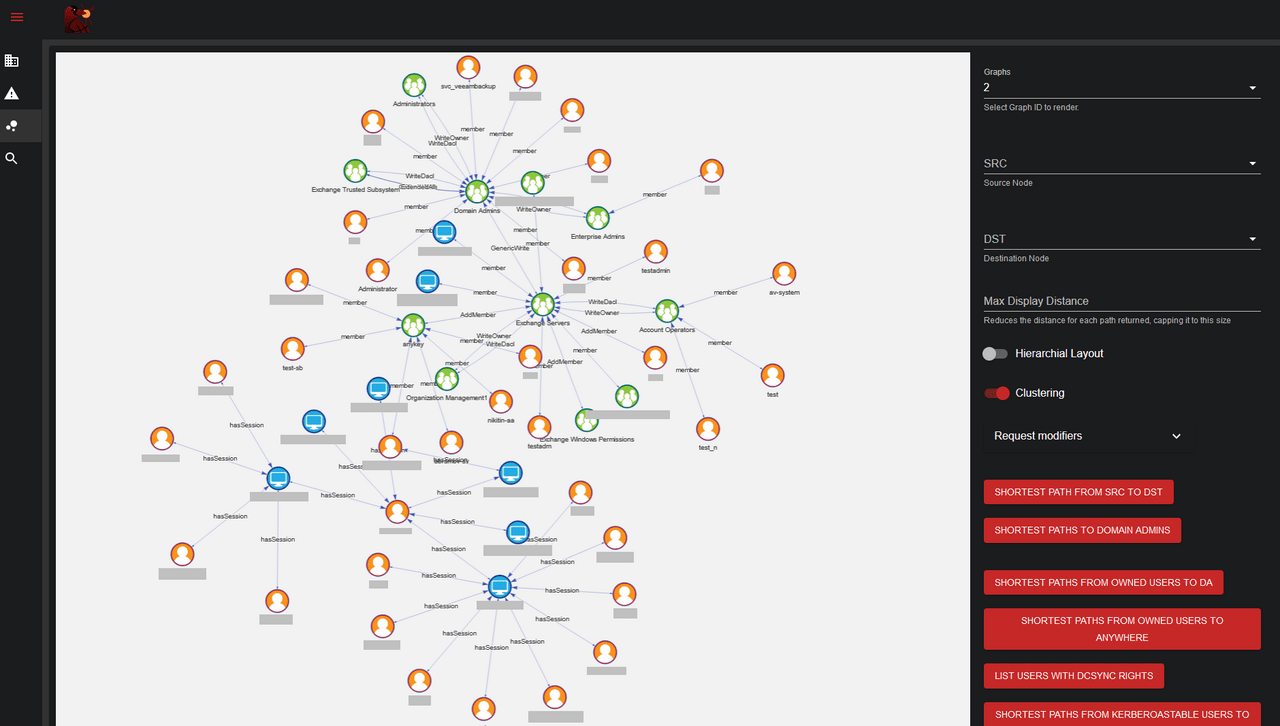
Therefore, interactive tools that display the results of queries in the form of a graph are particularly popular. In practice, BloodHound is considered one of the most convenient and useful of the interactive tools. Its advantages include the presence of an active user community, the possibility of expanding the functionality and a convenient interface. In fact, no domain penetration testing with Active Directory in mind is complete without BloodHound. That is why the main attention will be paid to this tool.
However, some of the other tools presented also deserve attention. The use of alternative tools is especially relevant in terms of cross-checking the results obtained.
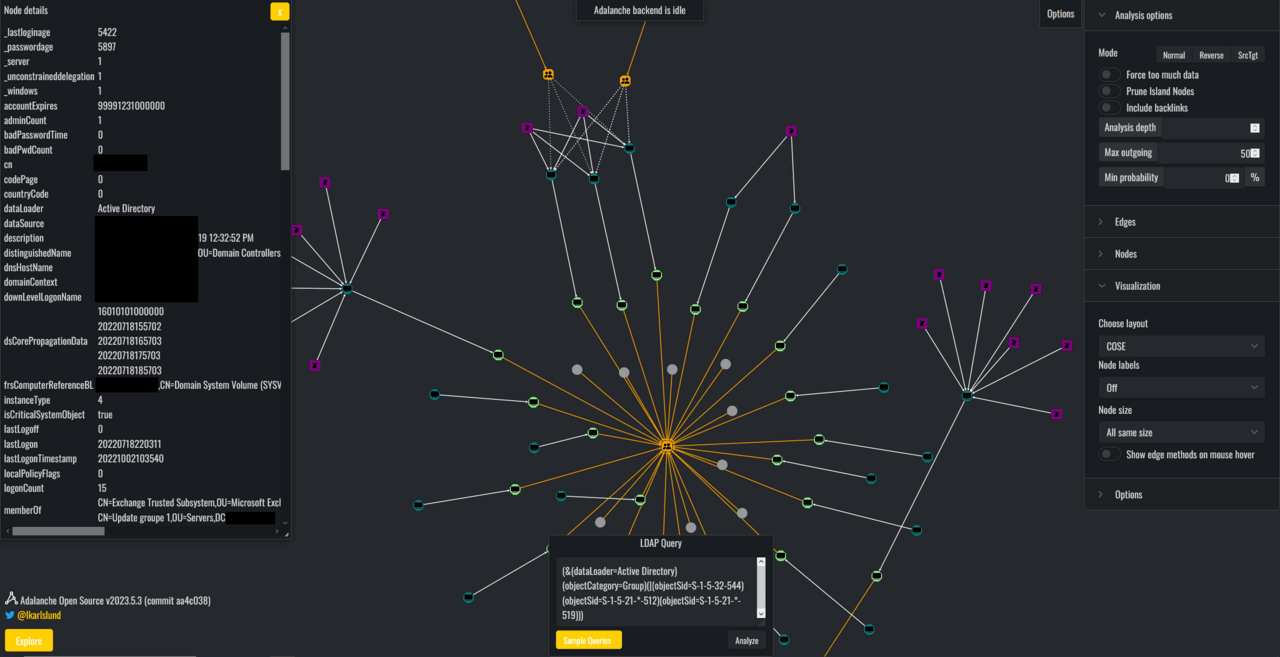
Of course, the best way to evaluate the tool is the “machete method”, that is, just start using it, even if at first and without going into much detail. I recommend trying to apply the specified method to Jackdaw and Adalanche.
Next, we will look at some of the ways to extend BloodHound.
BloodHound provides a graphical interface for working with the Neo4j database. Queries to the Neo4j database can be:
“graph” – the result is a graph that can be displayed in the BloodHound application.
“Console” – the result is a table with rows that can be viewed in the Neo4j Browser. These queries cannot be run in the BloodHound interface.
BloodHound allows a specialist to add their own frequently used graph queries to the interface. To do this, they need to save these queries in a specific format in the customqueries.json file.
In Windows, this file is saved in the following path:
C:\Users[USERNAME]\AppData\Roaming\BloodHound\customqueries.json
On Linux:
~/.config/bloodhound/customqueries.json
You can see examples of additional user queries, as well as familiarize yourself with the structure of the customqueries.json file, in the following sources:
Bloodhound: Intro To Cypher – докладніше про мову запитів
BloodHound Cypher Cheatsheet – строкові та графові запити
mgeeky – безліч групованих запитів
By default, BloodHound processes information obtained using the standard collector – SharpHound. However, the program architecture allows you to add new entities: objects, object attributes, as well as relationships.
Before detecting any attack vectors, it is advisable to fill the space of possible options as much as possible, that is, collect and load into BloodHound as much information as possible.
Let’s consider one of the current examples of adding new entities to BloodHound.
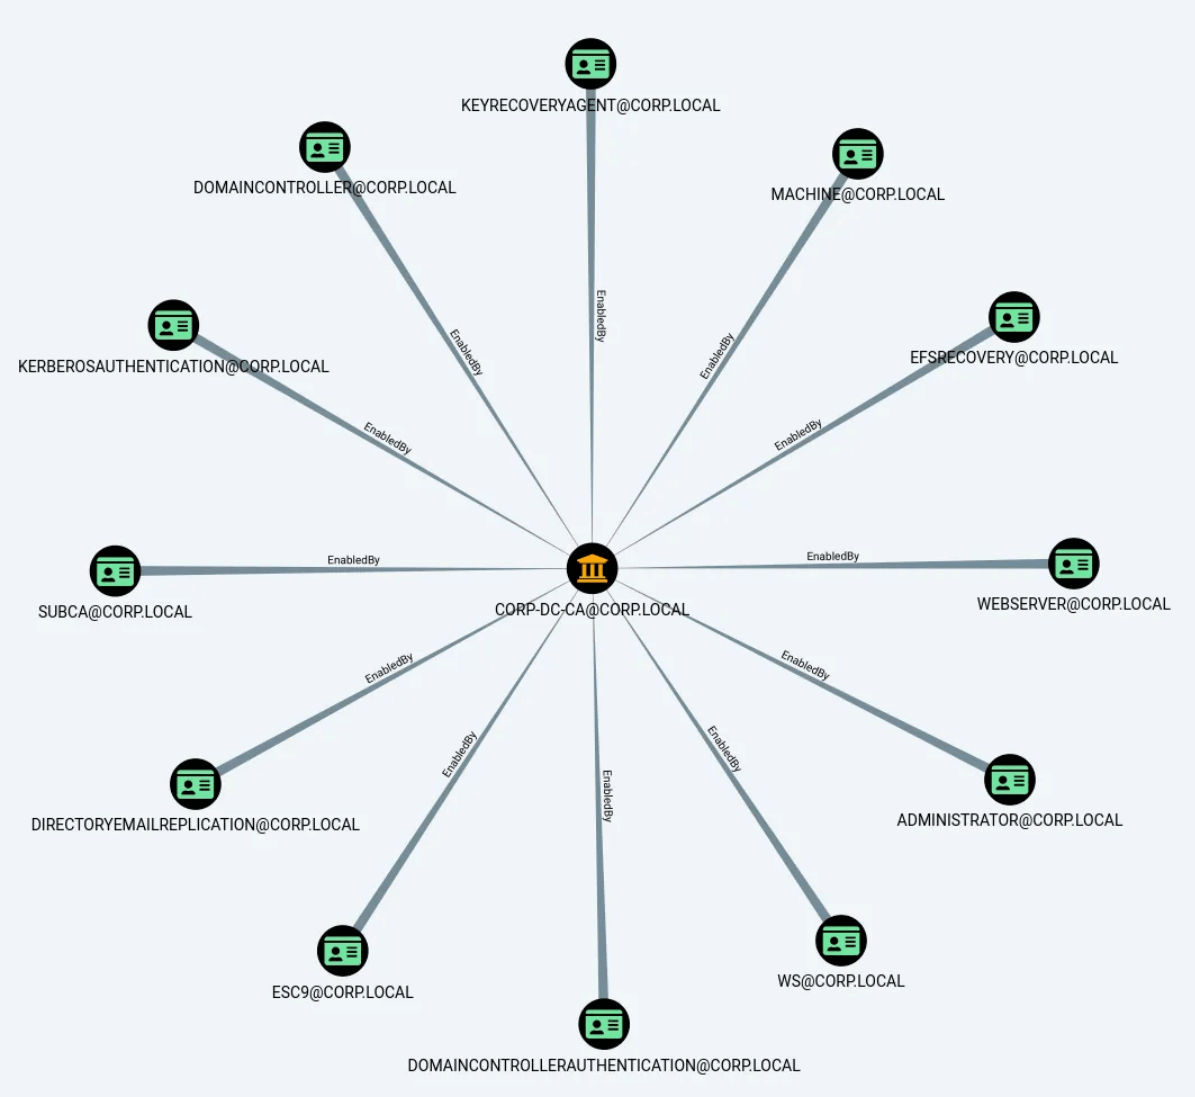
Влітку 2021 року була опублікована знакова стаття Certified Pre-Owned:Abusing Active Directory Certificate Services. As a result of the publication, the arsenal of penetration testing specialists has been enriched with many new attack methods related to the exploitation of dangerous settings of certification authorities.
Later, software tools appeared that automate the search and exploitation of vulnerable settings. One of these tools, called Certipy, has an information collection module that can integrate with BloodHound.
As a result, the following data may be additionally loaded into BloodHound:
certificate authority settings
certificate issuance templates
Also, with the help of Certipy, new relationships (“enroll”, “ManageCA”, etc.) between standard and new entities are added to BloodHound. Moreover, the author of Certipy also created his own version of BloodHound to beautifully display new entities, i.e. display their icons and a tab with properties that appears when the entity is selected.
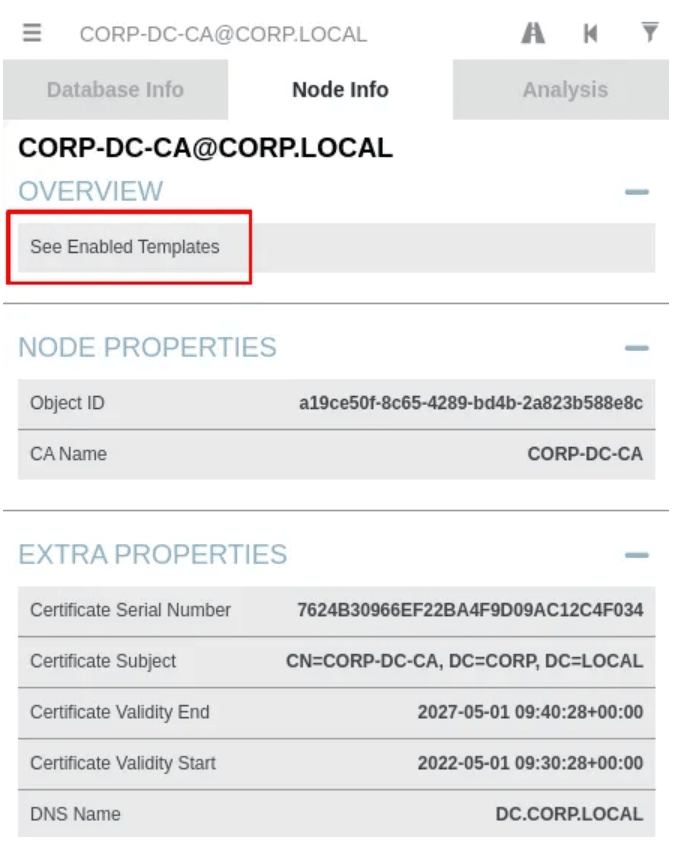
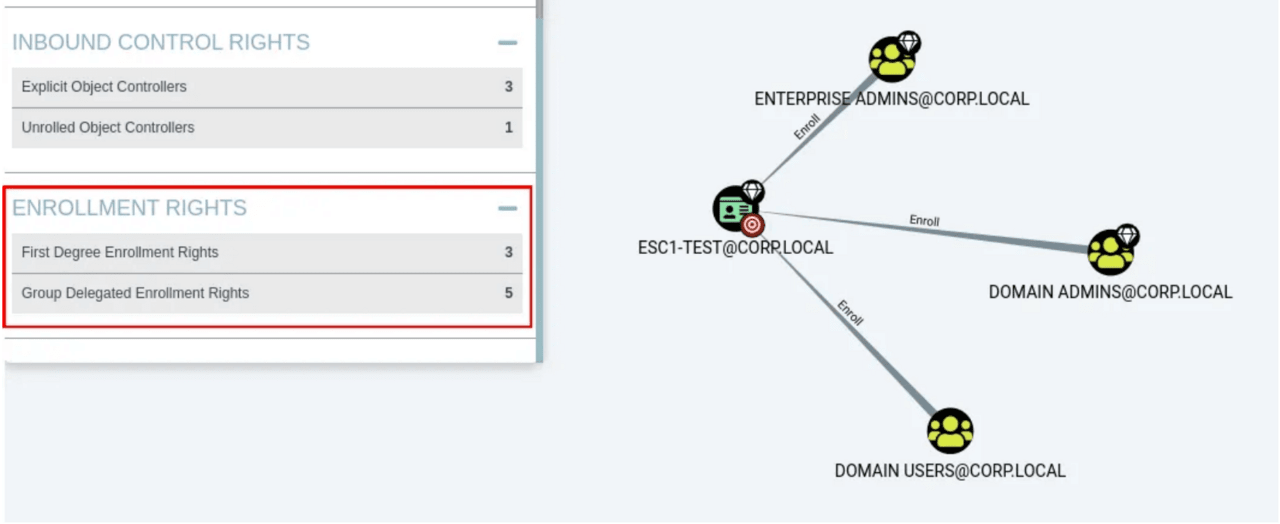
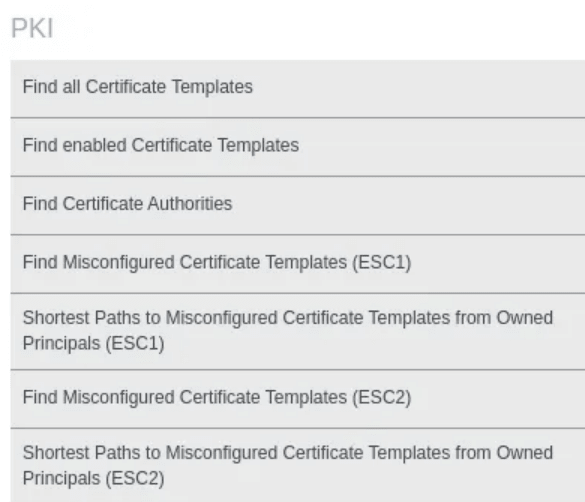
In addition, for convenient work with the received data, Certipy provides a list of typical queries to BloodHound.
It is important to note that despite all its splendor, Certipy sometimes provides incorrect information. This is due to incorrect verification of access rights to certificate templates. In this regard, it is better to focus on PingCastle, in which the analysis of settings is performed correctly.
Sources used:
Certipy 2.0: BloodHound, New Escalations, Shadow Credentials, Golden Certificates, and more!
Certipy 4.0: ESC9 & ESC10, BloodHound GUI, New Authentication and Request Methods – and more!
From the example considered earlier, it is clear that BloodHound can independently add support for completely new entities.
A full analysis of adding new entities is beyond the scope of this material. Nevertheless, for more experienced readers, I will indicate a direction that allows you to understand the issue.
I recommend taking the following two versions of BloodHound:
Next, using WInMerge, you need to compare the specified versions with each other. As a result of the comparison, you will see where and how you need to correct the program code. All that remains is to make the necessary changes by analogy and recompile the program.
In general, basic knowledge of programming is enough to figure out how to add a completely new object to BloodHound.
Let’s continue to consider ideas for enriching BloodHound with new entities.
First of all, it is worth noting that BloodHound works with information at the “administrative” level, that is, with attributes of domain objects. However, other levels can be added: “application” and “network”.
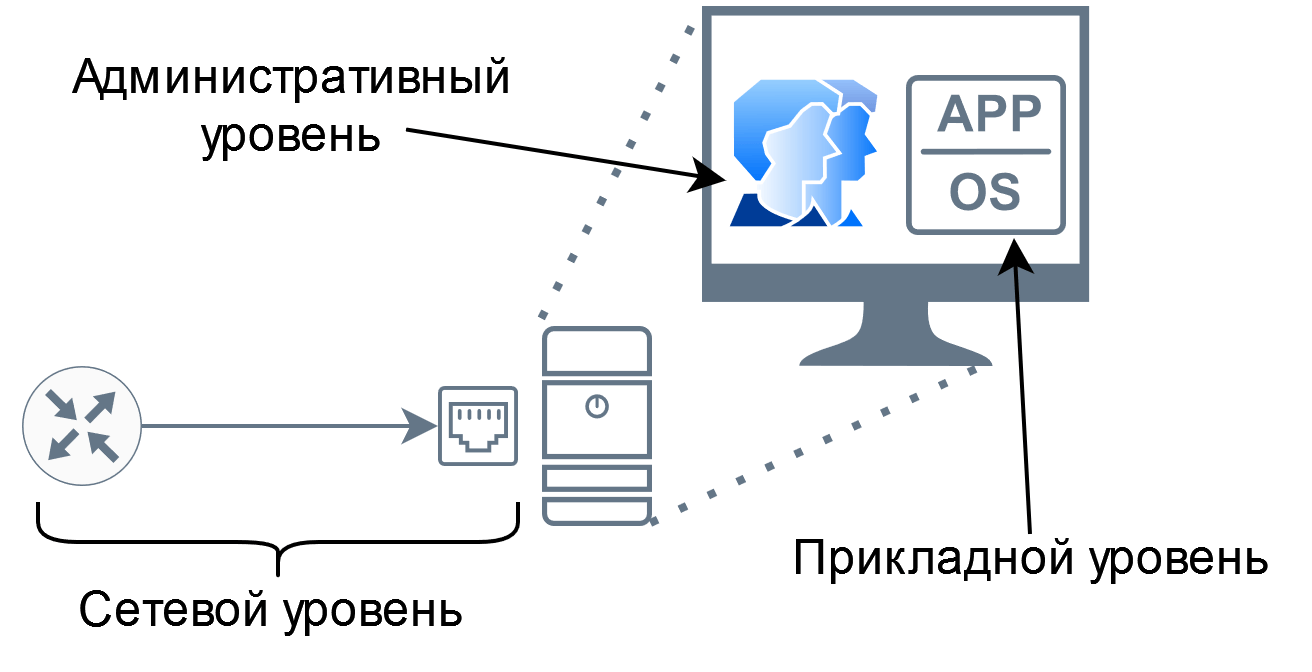
The “application” layer contains information about the software used. In essence, adding objects at the application layer is reduced to instrumental scanning for the presence of critical vulnerabilities.
Suppose one of the servers in the domain is susceptible to MS17-10. In this case, it makes sense to mark the specified server as compromised and further build attack vectors taking into account the new starting point.
Also at the application layer, you can highlight web applications for further search for vulnerabilities or account brute-force. You can perform this search using Witness-like tools, for example, GoWitnes.
At the “network” level, the accessibility of an object should be assessed in terms of network access delimitation rules. There are two ways to check accessibility:
by analyzing the rule settings in the configuration files of telecommunications equipment
by performing a scan
In terms of network scanning, the cornershot tool is particularly interesting. One of the distinctive features of this tool is the ability to check the network availability of node B from node C while being on node A.
Thus, as a result of the “network” level analysis, the number of false vectors can be reduced, for example:
there is a “CanRDP” edge, but in fact it is impossible to connect via RDP
there is a critical vulnerability, but there is no network access to the service required to exploit the vulnerability
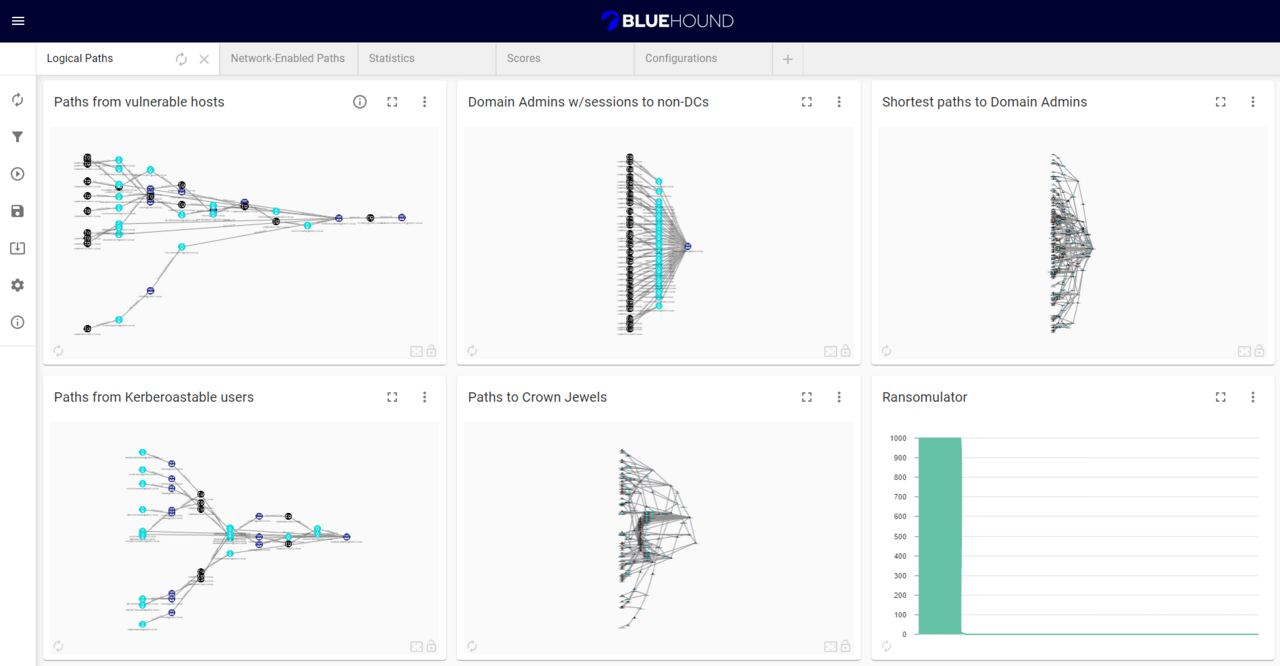
An attempt to implement the considered approaches was made in the BlueHound and ShotHound tools.
You can also search for systems with multiple network interfaces:
Using the above tools, you can detect network access to third-party subnets, for example, technological ones.
The fact that Sharphound collects a lot of information from domain group policies does not mean that there is nothing else interesting to find in them.
In 2020, Riccardo Ancarani wrote an excellent article ” Extending BloodHound Part 1 – GPOs and User Right Assignment “, which describes how to supplement BloodHound with information about the presence of critical privileges in domain users.
The fact is that group policies can be used to assign privileges, including “dangerous” ones, for example:
SeAssignPrimaryToken
SeBackupPrivilege
SeCreateTokenPrivilege
SeDebugPrivilege
SeImpersonatePrivilege
SeLoadDriverPrivilege
SeRestorePrivilege
SeTakeOwnershipPrivilege
SeTcbPrivilege
Possession of any of these privileges allows a user to successfully elevate their rights locally to the system level. For more information on exploiting these privileges, see the report “Show me your privileges and I will lead you to SYSTEM”
In BloodHound, the resulting attack graph looks like this:
In addition, it is important to highlight the privilege SeEnableDelegationPrivilege, which allows you to compromise not a single system, but the entire domain.
The issue of improving Bloodhound is also of interest to other domestic researchers. Recently, Dmitry Neverov published three articles on this topic.
One of the articles “Extending the ACE list for BloodHound” shows how to add the following new edges to BloodHound:
WriteGPLink
WriteGPOptions
WriteSAMAccountName
WriteUserAccountControl
WriteTSInitialProgram
WriteScriptPath
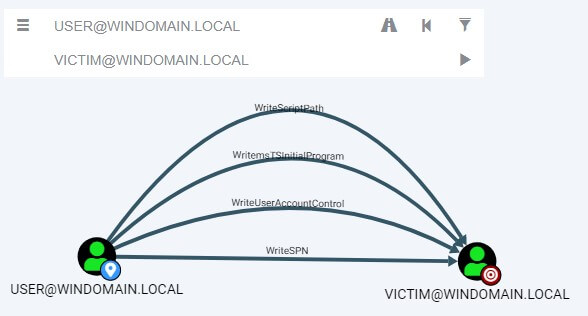
I recommend reading Dmitry’s articles in full. Among other things, his materials reveal the technical process of implementing new entities in BloodHound.
I would like to note that the list of rights considered in the article can be supplemented with the extended right DS-Validated-Write-Computer, which allows for a ShadowCredentials attack.
Another primitive that can be added to BloodHound is an edge, indicating that the user account is used as a service account on a particular system. According to the author, in 2/3 of cases it is possible to obtain the password in clear form to the specified account from the LSA secret store.
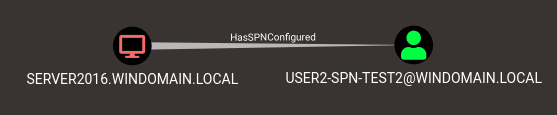
To create the specified edge, you can use the add-spns utility with Max.
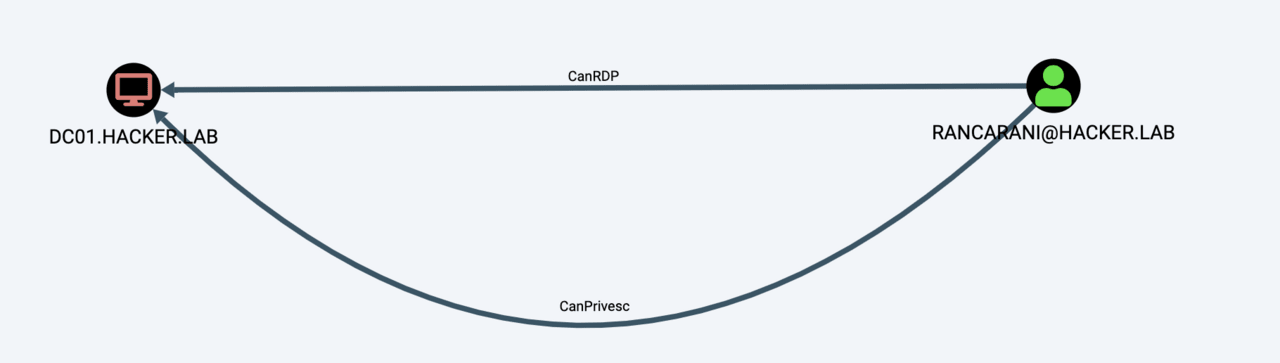
Consider the following two results of a query to find the shortest path to domain administrators:
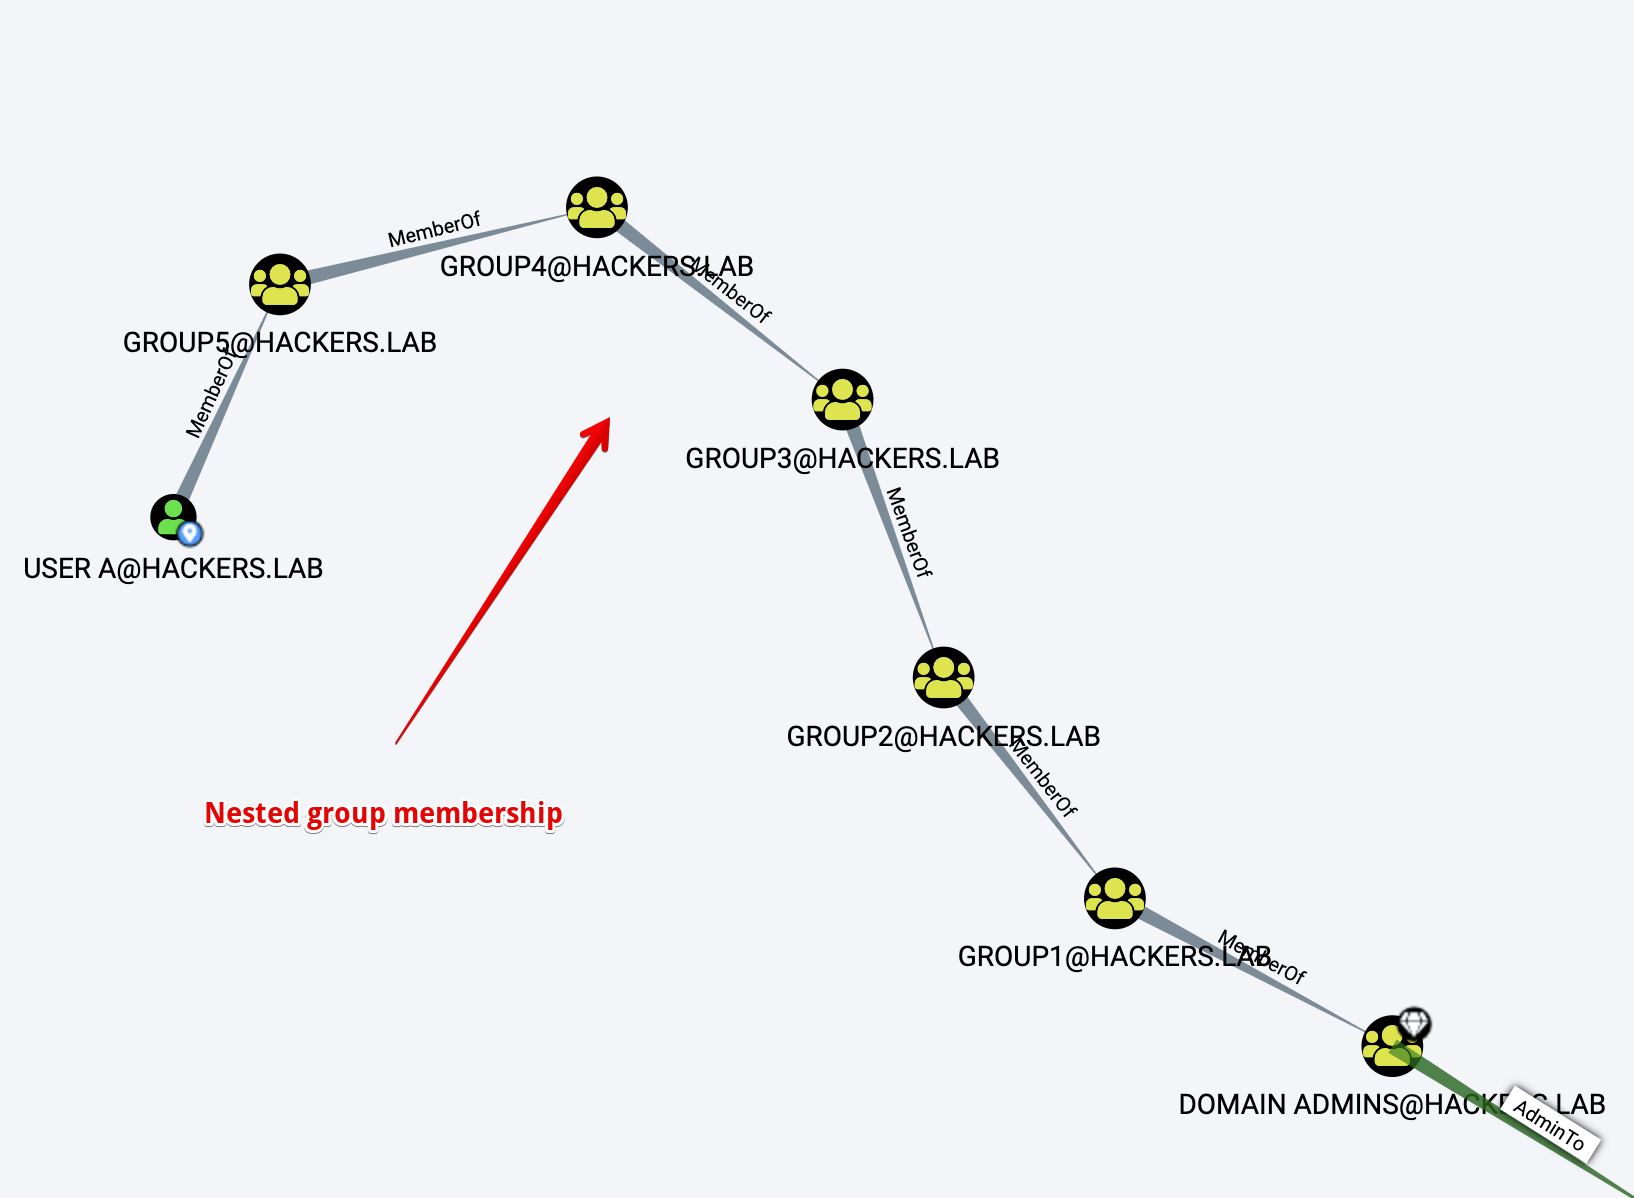
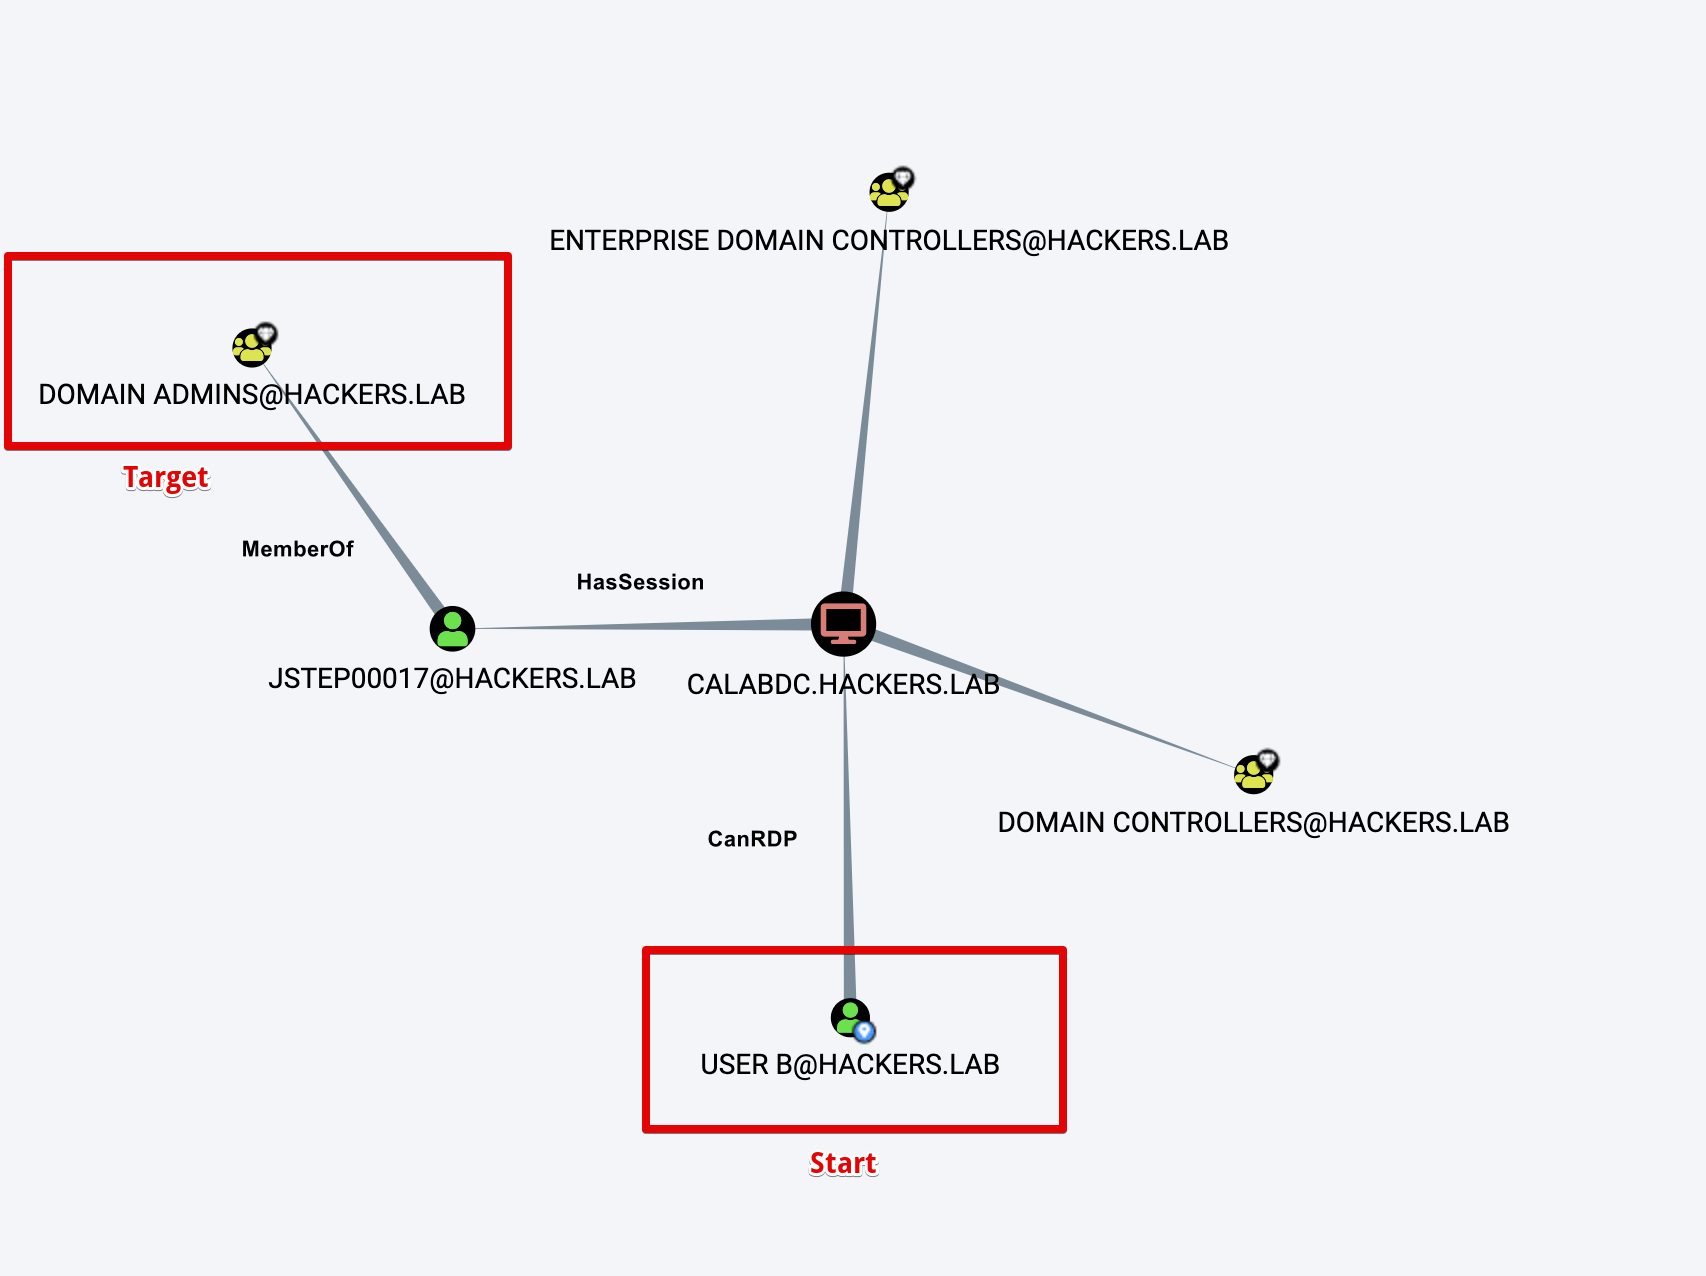
From the point of view of BloodHound, the second path looks better, because it is shorter than the first. In fact, on the contrary, the first path represents a sequence of nested groups, that is, no effort is needed to access the “Domain Admins” group. The second path requires additional conditions to be met, in particular, “User B” after RDP login must somehow increase his rights to “CALABDC.HACKERS.LAB”.
The above example well illustrates the idea: “different edges of the graph have different characteristics, which are not taken into account in BloodHound”.
The following parameters can be considered as characteristics:
the complexity of moving along the edge in terms of implementation practically
the secrecy of exploitation
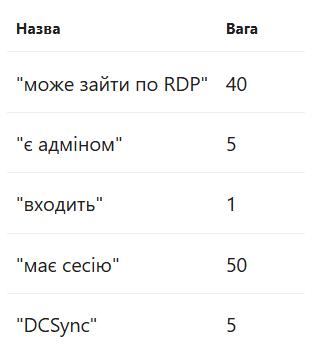
Having decided on the categories of characteristics, the specialist must manually set the weight parameters for each of the possible edges of the graph. The result is the following table:
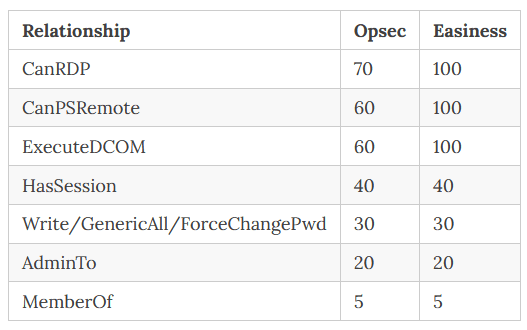
The worse the property is, the higher the weight. I will note right away that the task of distributing the scales is reduced to the expert assessment of a specialist.
After distributing the weights, it is necessary to compose the appropriate queries for further work. By default, BloodHound does not take into account the weights when searching for the shortest paths. To use the shortest-distance search algorithms in Neo4j in a weighted graph, you should connect the Graph Data Science library.
The issue of using weight coefficients is described in more detail in the article Not All Paths are Created Equal.
You can learn more about the concept of multi-layered security architecture at the following links:
Broadcast recording in the format of a test interview
Mitigate Credential theft with Administrative Tier Model – copy of the article from the official Microsoft documentation
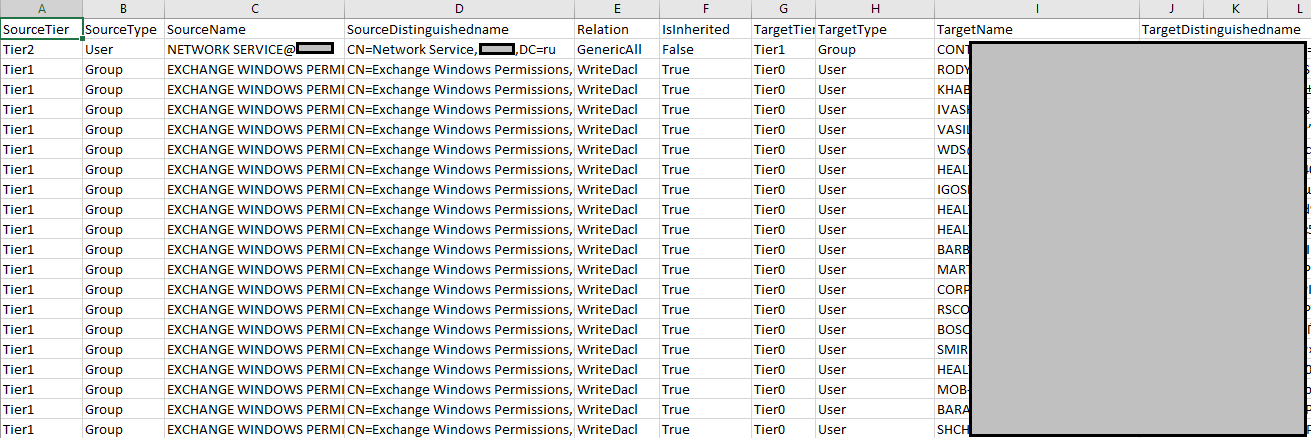
Regarding BloodHound, there is a tool called ImproHound, which allows you to distribute all domain objects between three levels.
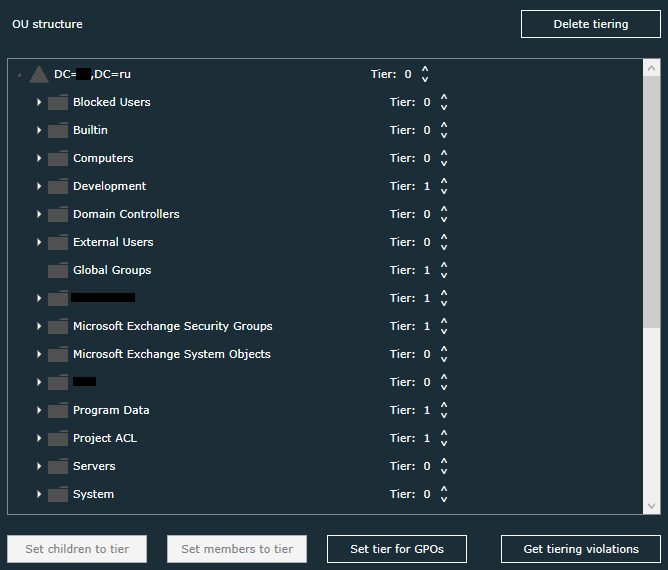
After the distribution is complete, the tool searches for paths between lower-level objects to higher-level objects and presents the result in the form of a csv table.
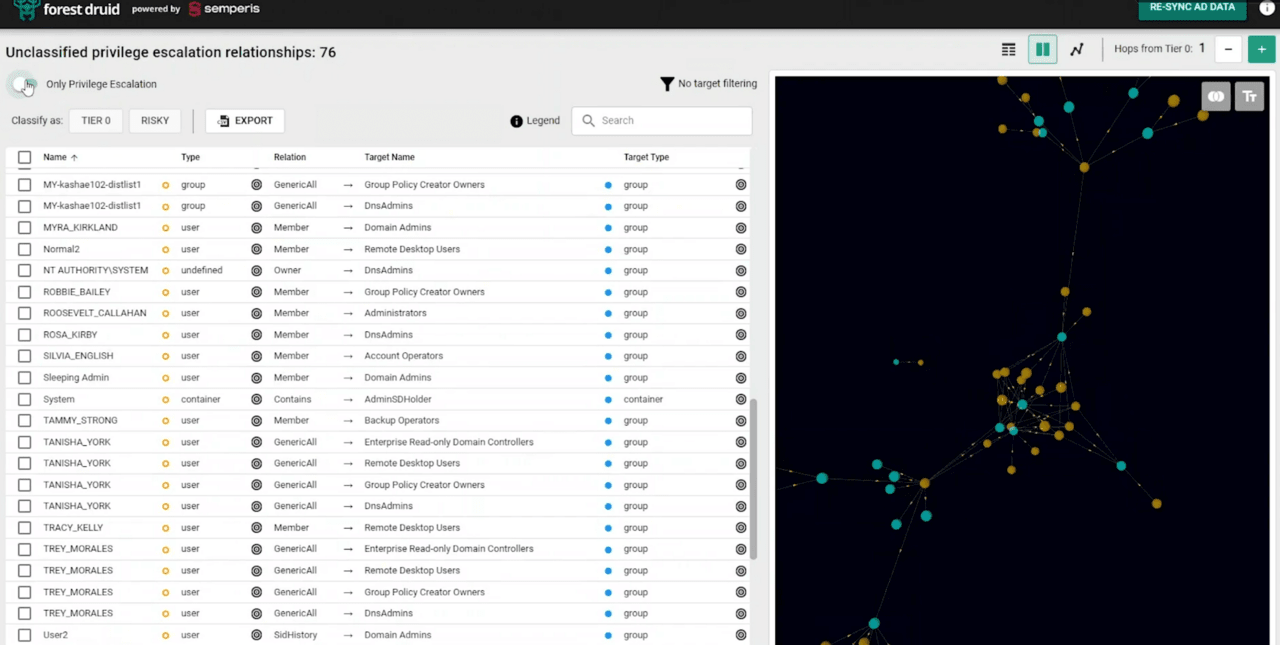
As an alternative solution, but without being tied to BloodHound, you can consider the Forest Druid program.
When building attack vectors, it is important to identify the initial access objects. In the future, the search for vectors is carried out under the assumption of control over the specified objects. In BloodHound, the equivalent of an initial access object can be considered the “owned” tag.
Earlier, some examples of initial access objects were briefly discussed. For greater order and centralization of information, I will give an extended list of objects that can be considered as starting points:
Accounts susceptible to kerberoasting or kerberoasting attacks (in some cases)
Accounts with passwords in the description or materials of publicly available information leaks, as well as network folders
Accounts susceptible to password spraying attacks
Machine accounts with set passwords (Diving into Pre-Created Computer Accounts, Diving Deeper)
Systems with critical vulnerabilities
Accounts that allow an attacker to learn the NTLM v1 hash of their passwords
Systems that allow anonymous connections
Systems with third-party services that allow you to pick up the account and gain access (ssh, databases, vnc, web portals, etc.)
User accounts have dictionary passwords and allow an attacker to learn NTLM v2 from the hash of their passwords
Accounts obtained during Wi-Fi security analysis based on WPA2 Enterprise
Accounts obtained from printers
Systems susceptible to MouseJack
Some utilities use the data processed in BloodHound to produce static reports. Let’s take a closer look at two of them.
PlumHound makes it easy to create report attachments. Here are just a few of the sections that can be created using this utility:
list of outdated operating systems with DNS names
list of user sessions
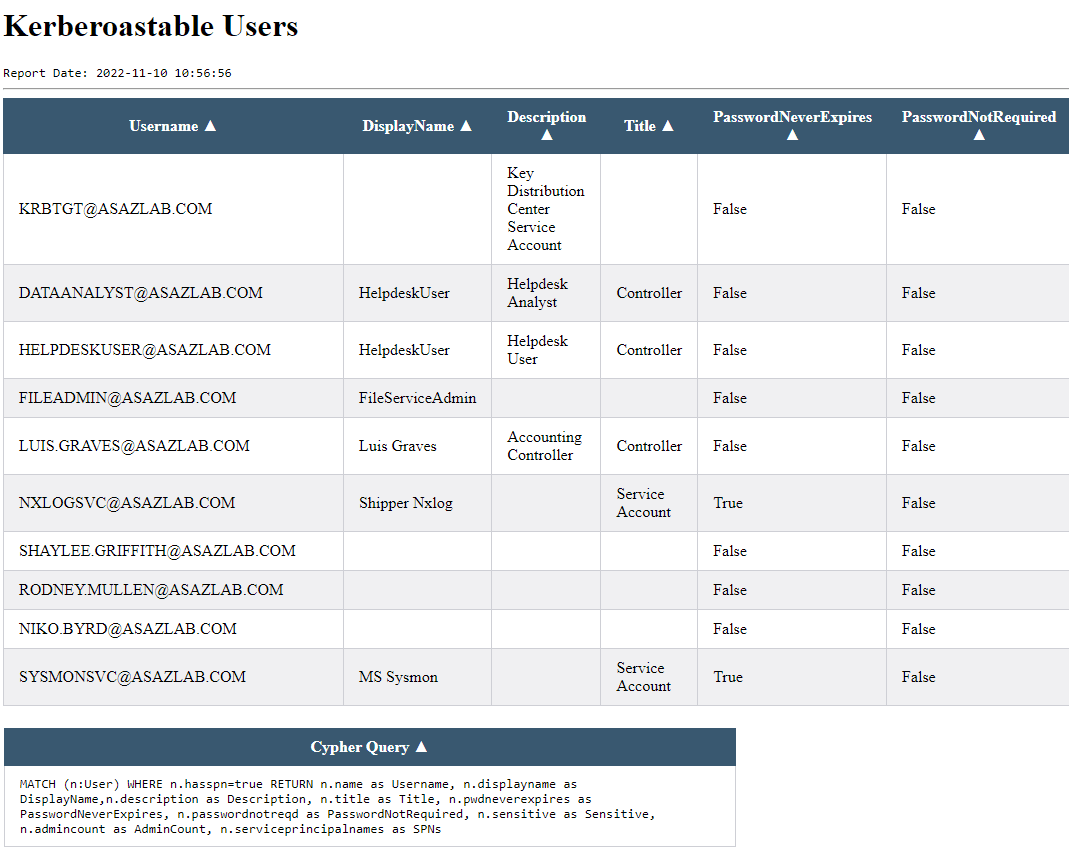
list of accounts vulnerable to Kerberosting attacks
It is important that the program is designed to add arbitrary user queries. Thus, PlumHound can be used to work with new entities.
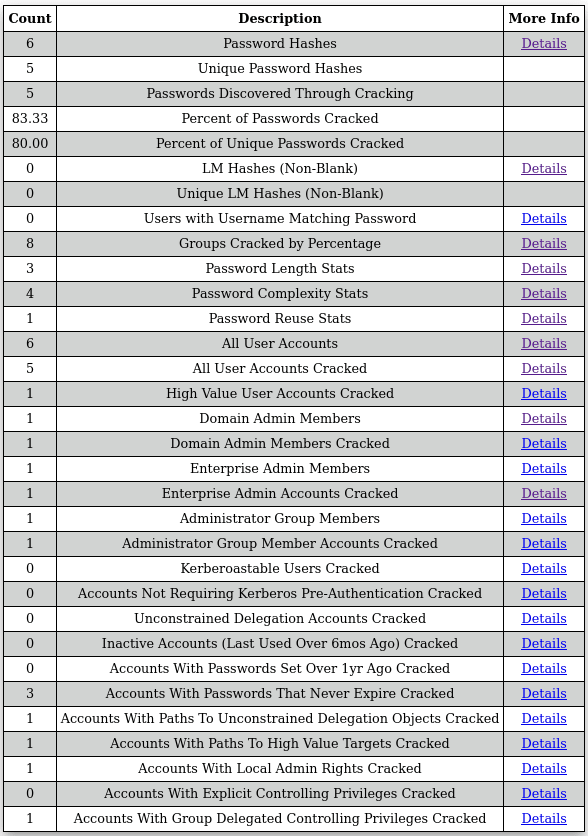
The feasibility of analyzing the unloading of NT hashes of domain users is a rather debatable issue. Experts’ opinions on this matter differ, but if you are conducting the specified analysis, then you should pay attention to the DPAT-max tool.
As input data, DPAT-max accepts a Hashcat potfile, a list of accounts with NT hashes in pwdump format, as well as a BloodHound login and password.
The final report has the following sections:
You can learn more about the capabilities and device of DPAT-max on the blog of the author of the mentioned utility: Max: BloodHound Domain Password Audit Tool.
The following articles discuss additional ways to visualize the information collected for BloodHound, including using Jupyter Notebooks:
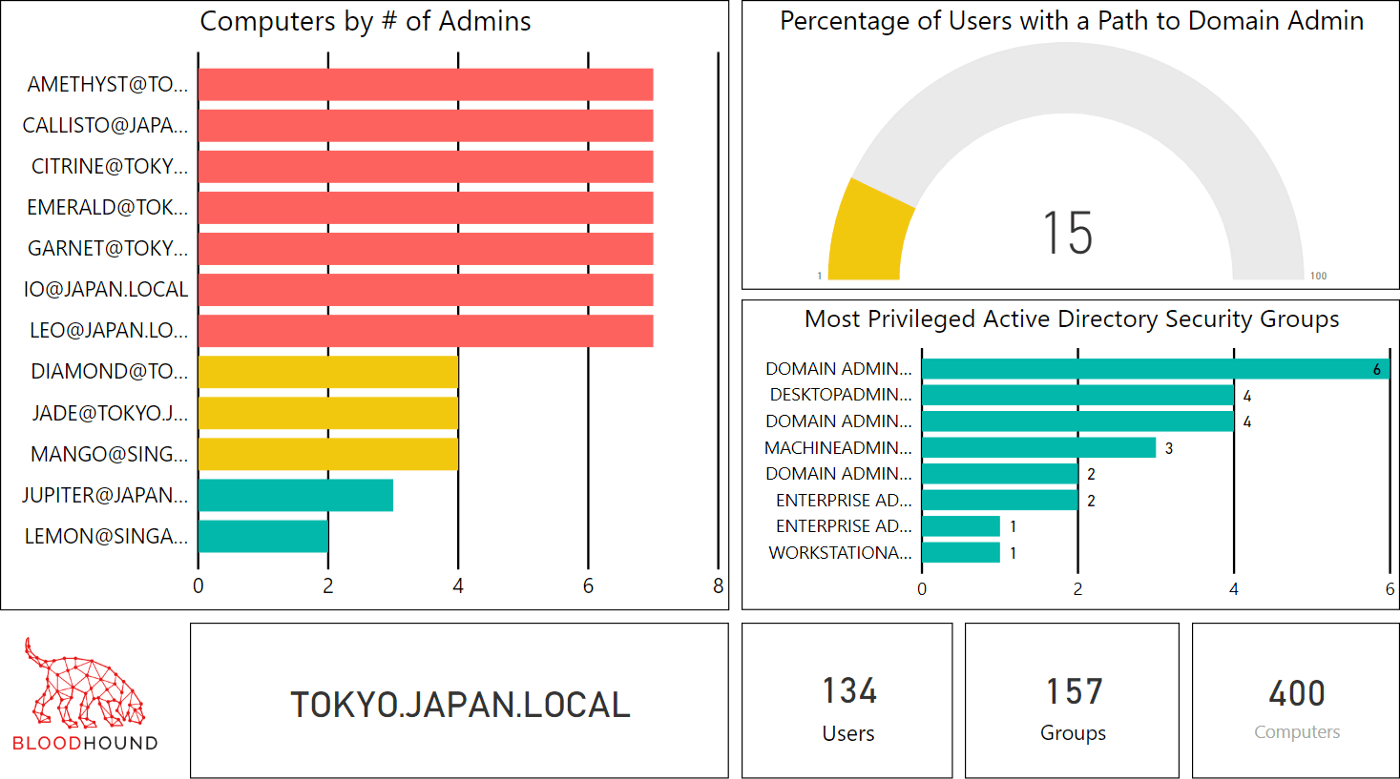
“Visualizing BloodHound Data with PowerBI” частина 1 , частина 2
“Jupyter Notebooks for BloodHound Analytics and Alternative Visualizations”
Also, for general development, I will list a number of utilities that could not be attributed to any section earlier.
ADExplorerSnapshot.py – конвертер знімка стану домену, зробленого за допомогою AD Explorer в JSON файл імпортований BloodHound.
ldd2bh – конвертер ldapdomaindump у формат BloodHound, може стати в нагоді при релей атаках.
ACLPwn – старий скрипт для автоматизації експлуатації вразливостей, виявлених у BloodHound
Max – утиліта, що включає ряд різних модулів, частина з яких не була розглянута раніше
To make it more difficult for an attacker to conduct reconnaissance using BloodHound, you should minimize the amount of information they can collect. You can do this by:
Restrict access to the list of user sessions.
Prevent uploading the list of users and groups from Active Directory using the SAMRPC protocol.
Disable anonymous accounts
Exclude the “Authenticated Users” group from the “pre-Windows 2000 compatible access” group
From the material considered earlier, the following conclusions follow:
BloodHound can be enriched with many new attributes, objects and relationships
“enriched” BloodHound can be supplemented with new queries
based on queries, you can create automated reports or interactive visualizations
As shown earlier, BloodHound contains a lot of data on the basis of which it is possible to build probable vectors of computer attacks. Management of the specified vectors allows to solve various tasks.
On the one hand, the protected can proactively determine the most likely attacked objects of the domain in order to eliminate vulnerabilities and shortcomings in the configuration of the specified objects as a priority.
On the other hand, attackers can identify the most priority targets for computer attacks in order to further advance or consolidate in the domain.
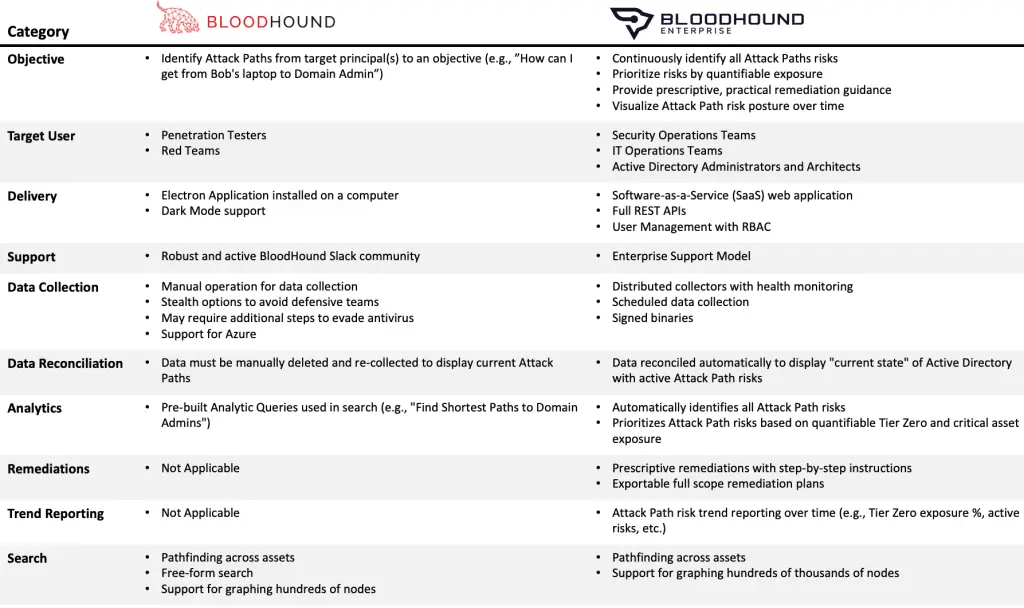
The creators of BloodHound, of course, did not ignore such a promising direction for the development of their tool and released a full-fledged product BloodHound Enterprise on its basis.
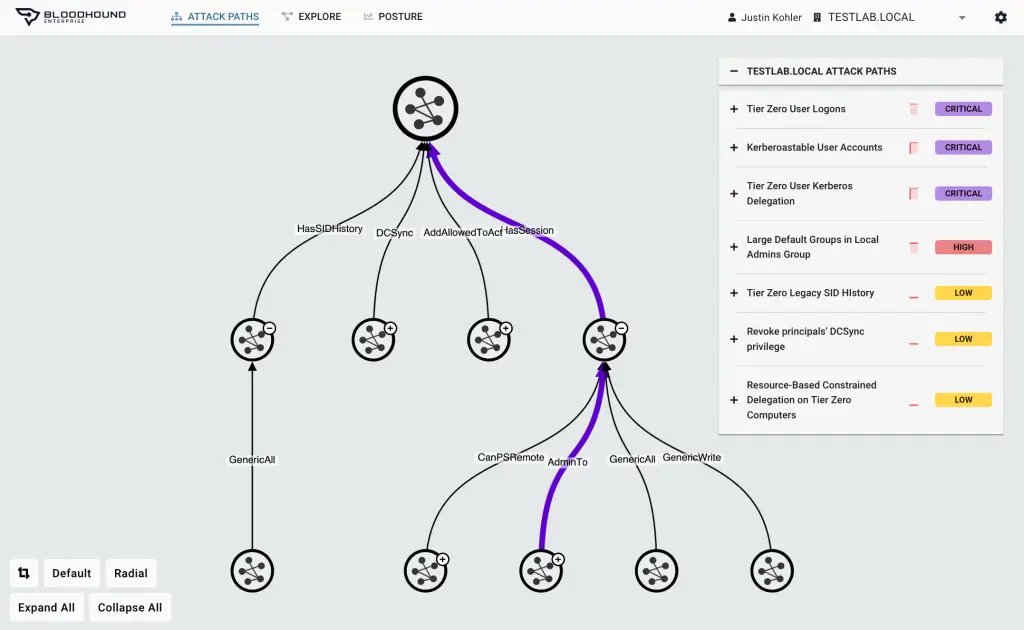
The official BloodHound website has a lot of marketing slogans, which is normal for a paid product website. However, in addition to the colorful headlines, the BloodHound authors have written a number of articles on the topic of attack vector management:
3 Foundational Pillars for Attack Path Management: Pillar 1 — Continuous & Comprehensive Mapping
3 Фундаційні Pillars для Attack Path Management: Pillar 2 — Empirical Impact Assessment
It is important to note that BloodHound Enterprise has a Software-as-a-Service distribution model, which, combined with the lack of a publicly available trial version, does not allow the average researcher to evaluate this product. If anyone has the opportunity to provide access to the BloodHound Enterprise interface, I would be grateful.
Before releasing the paid version, the creators of BloodHound had already tried to use it to manage attack vectors:
Additionally, some researchers have looked at the BloodHound graph from the perspective of analyzing the possible spread of an attacker, in particular ransomware:
Adversary Resilience Via Least Privilege Networking – Part 1
Adversary Resilience Via Least Privilege Networking – Part 2
Significant objectsOne of the key issues regarding attack vectors is identifying the most significant objects.
For a better understanding, I will give the following loose definition: the most significant object is an object whose capture makes a significant contribution to the development of attack vectors.
Some approaches to identifying these objects and assessing their significance are done in practice, for example, in the following tools:
Also, at the time of writing this material, a series of articles was published:
We will not focus on the analysis of each of the presented tools. I note that the approaches to assessments proposed in them are valid, but seem relatively crude to me. At this point, I had a desire to reinvent my wheel.
To begin with, I will describe the task in a more formal way. There is a weighted multi-orgraph that reflects the likely attack vectors in the Active Directory domain, built from initial access objects to a given especially privileged target, for example, the Domain Admins group. It is necessary to determine the degree of significance of each element included in the specified multi-orgraph from the point of view of the attacking or defending party.
In fact, it is possible to build the most complete multi-orgraph, select initial access objects, and even distribute edge weights using the methods considered earlier in the section.
In the course of searching for a solution, in addition to Kangal and GoodHound, the feasibility of using the centrality algorithms built into neo4j was also considered. Given that the real material does not qualify for publication in the journal Science, without strict comparisons and various calculations, I will simply note that a personal intuition said that something better could be found.
As a result, the most interesting and promising idea for me seemed to be based on electrical circuits. Something similar can be read in the dissertation “Mathematical models of vertex ranking in graphs of communication networks”.
I will tell you a little more about the proposed idea. For illustration, let’s consider the following contrived example:
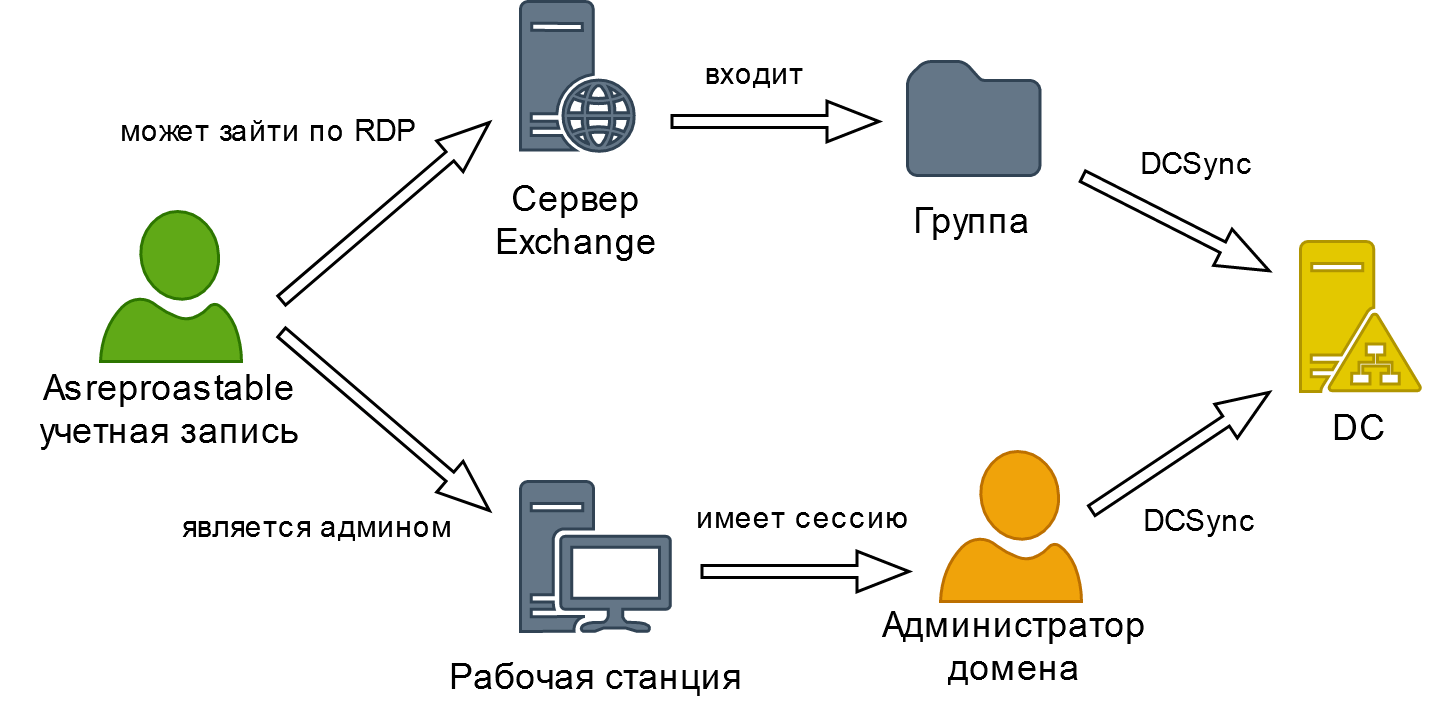
An account subjected to an AS-REP roasting attack acts as the initial access point, and the DC is a particularly privileged target.
For example, let’s make a table with weights:
Next, the resulting graph is converted into an electrical diagram according to the following rules:
The initial access points are converted into sources of EMF (current). Also as an improvement it makes sense to compile a separate table for different classes of initial access objects, in which, depending on the probability of capturing the specified objects, different voltages are assigned.
The transition edge is converted into a resistor connected in series with a diode. The resistance value is directly proportional to the weight of the edge. The diode is necessary to take into account the quality of the graph orientation.
A particularly privileged target is converted into grounding.
As a result, the fraction of the current flowing through the selected object out of the total current flowing can be considered a measure of the significance of the specified object.
For those familiar with Kirchhoff’s rules, the advantages of the proposed approach should be obvious. Using the Multisim program, an electrical circuit was simulated taking into account the proposed transformations:
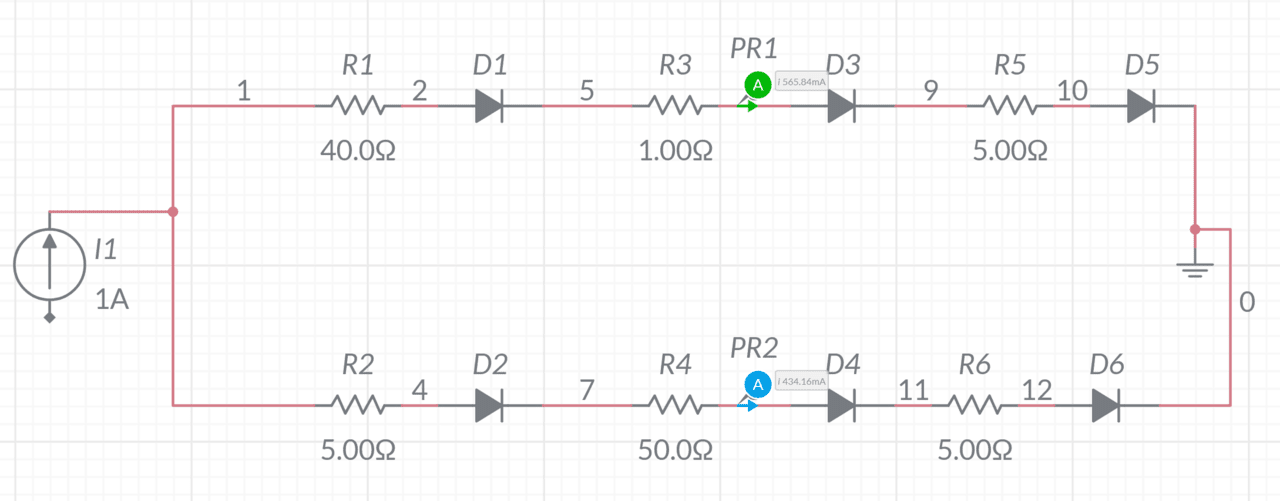
In this case, the significance measure of the upper objects is 56.5 units, and the lower ones are 43.5. Thus, from the attacker’s point of view, the upper path is 13 percent better than the lower one. Of course, this is only an illustrative example, and in practice, the circuits are much more complicated.
You can automate the construction and calculation of electrical circuits in Python using the ltspice module.
Not much lyricism. Current tends to follow the path of least resistance. An appropriate analogy is water flowing down a slope with different angles of inclination. Nature itself builds the most suitable route, and if there is already enough of it flowing, the water will still find another path.
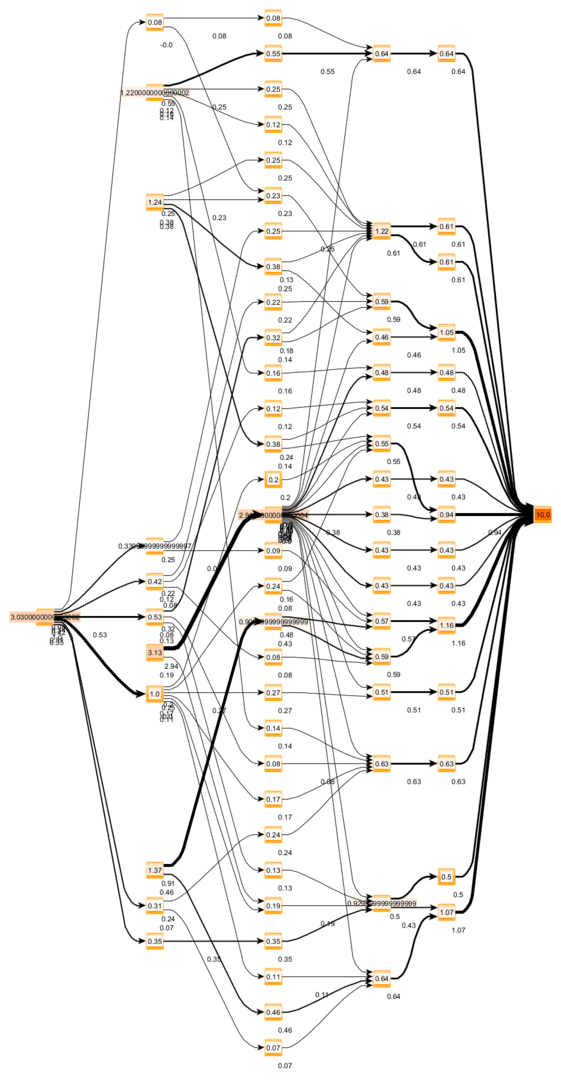
The final graph containing the calculated significance estimates can be downloaded in a generally accepted format (graphml) and visualized using various third-party tools. In this regard, yEd has shown itself well, in which, in particular, it is not difficult to establish the relationship between the thickness of the line and the amount of current flowing through the equivalent circuit.
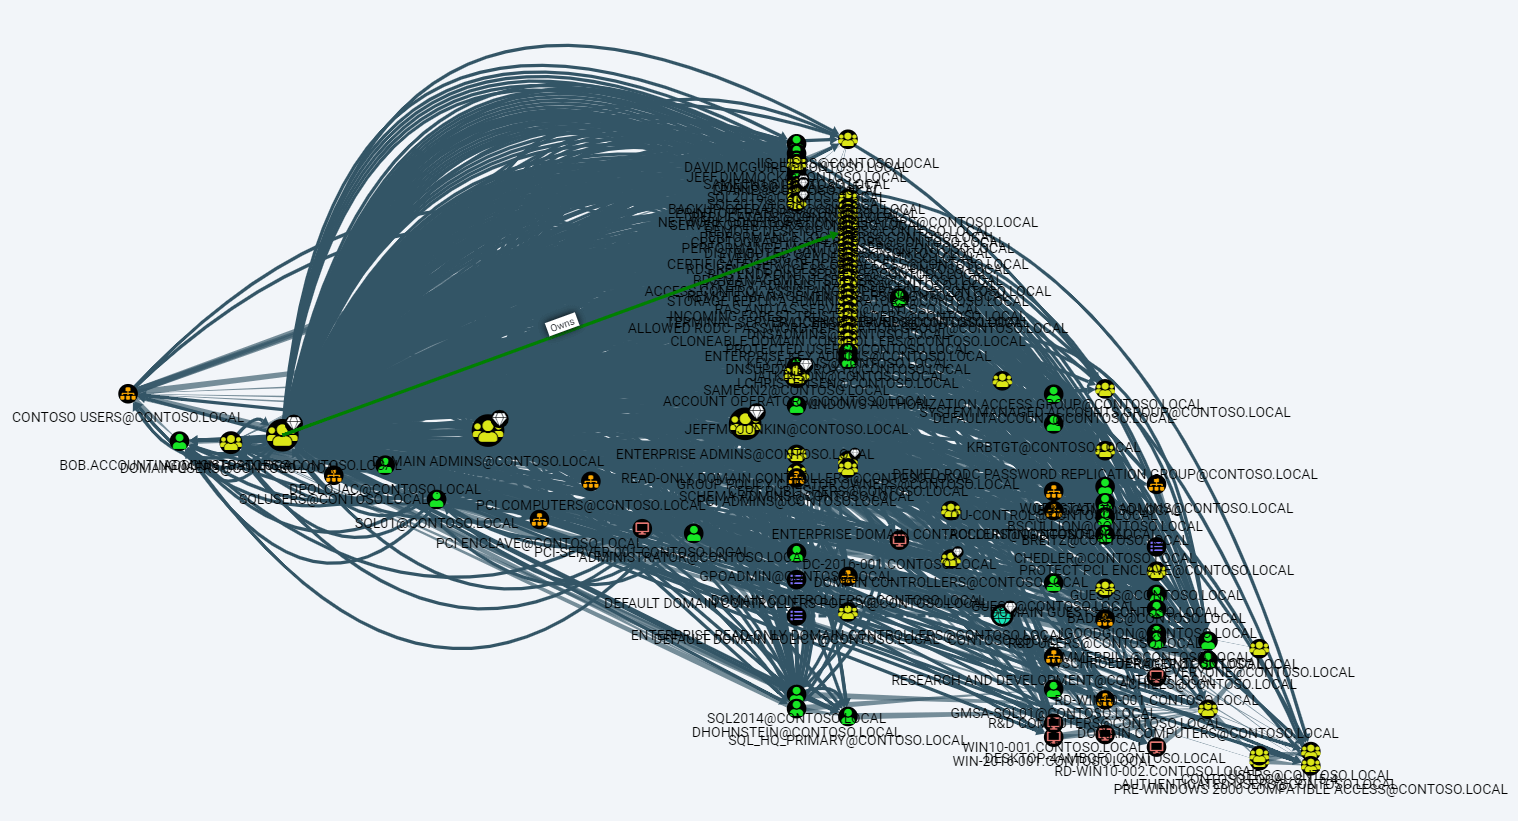
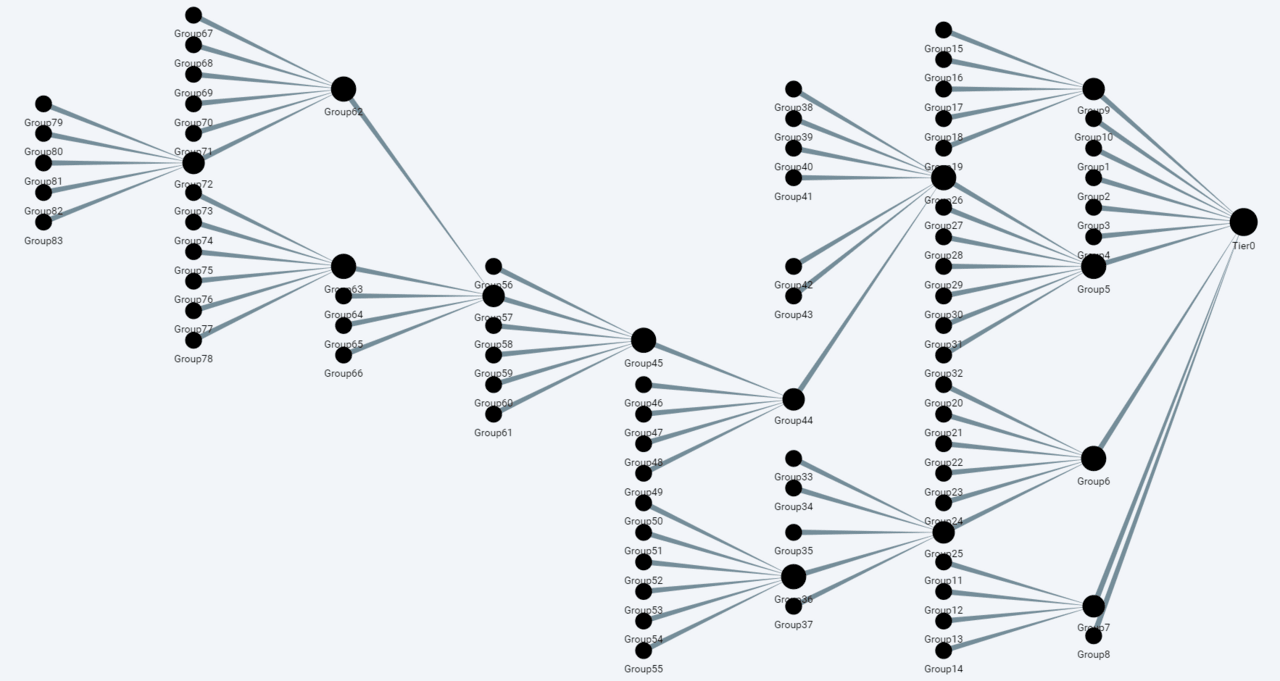
For example, the test graph below:
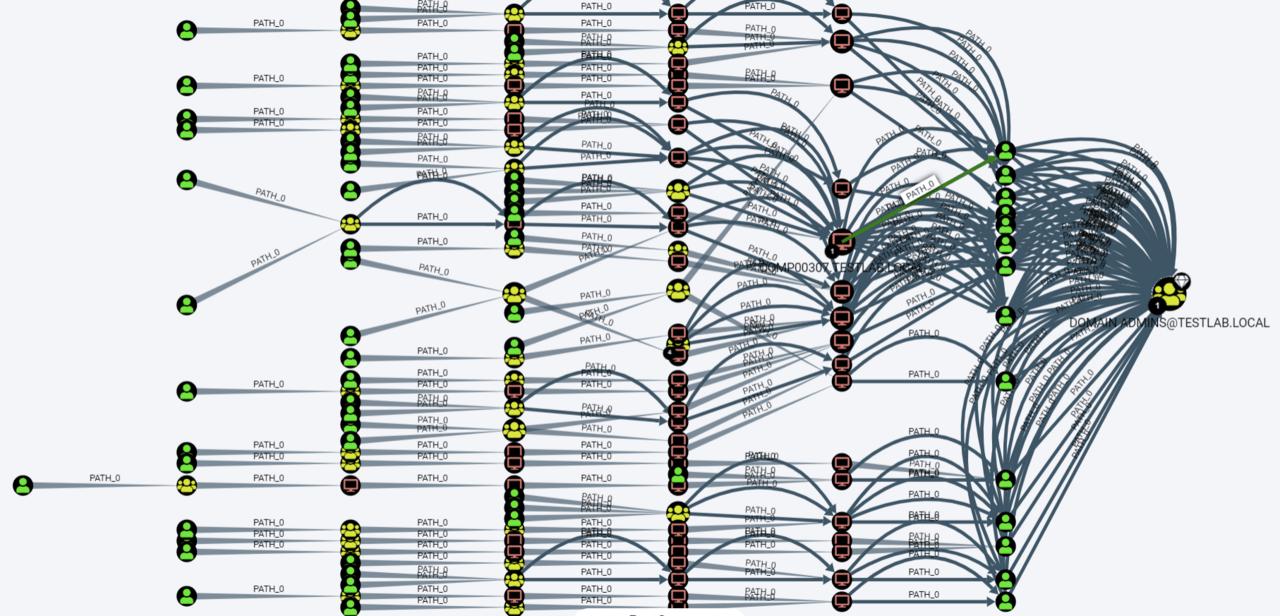
It turns into the following interactive visualization:
The presented material does not contain a ready-made solution, but rather includes many useful links for self-study and inspiration. Nevertheless, a number of the ideas discussed may be useful to specialists who wish to improve their approaches to the analysis of dangerous Active Directory configurations.
Also, in conclusion, my own algorithm for assessing the significance of Active Directory objects from the point of view of attackers and defenders was proposed and briefly described.