
01.06.2023
11 min
2595

Wireshark is a powerful tool for intercepting and analyzing network traffic, making it an indispensable assistant for cybersecurity professionals, system administrators, and developers. In this article, you will find useful life hacks that will help you decrypt SSL/TLS traffic, analyze packets on a server using tcpdump, and configure environment variables to record session keys on Windows, Linux, and Mac OS X.

Wireshark is a well-known program that is often used to capture and analyze network traffic. It will be useful not only to hackers or network engineers, but also to anyone who is interested in how various devices work, from a smartphone to a fitness bracelet or even a TV.
The program allows you to “capture” data packets from the network in real time and save them in pcap files, which can later be viewed and analyzed. This is useful for recovering information, studying the operation of the network or searching for possible threats. Wireshark is often used together with tcpdump, but thanks to its convenient interface, filters and additional functions, its capabilities are much wider and are suitable even for beginners.
Wireshark has a lot of features, but even a beginner with basic knowledge can benefit from it. Below are some examples of how the program can be used to solve basic networking tasks.
Chrome and Firefox allow you to record logs of session keys used to encrypt traffic using SSL/TLS. Our task is to enable the recording of these logs and then load them into Wireshark to analyze the encrypted traffic in detail. This is only possible if we have physical access to the computer of the user whose traffic we need to decrypt, or to the server that establishes encrypted connections with clients.
First, we enable key recording.
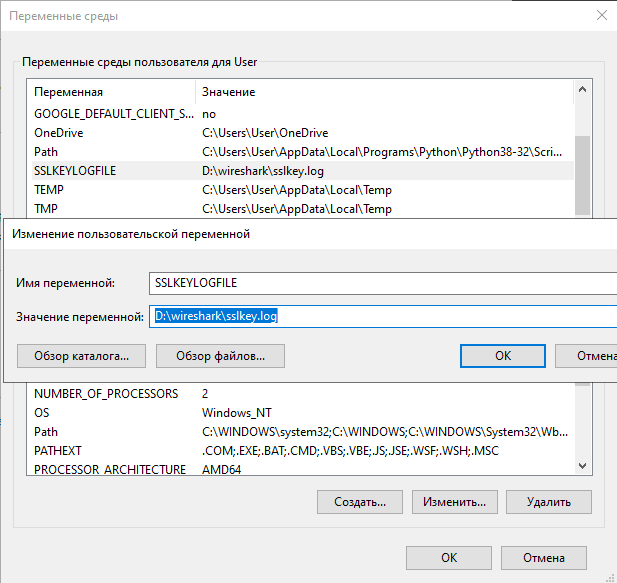
In older builds of Windows 10, the old method works. Go to Control Panel → System and Security → System. On the Advanced System Settings tab, click the Environment Variables button.
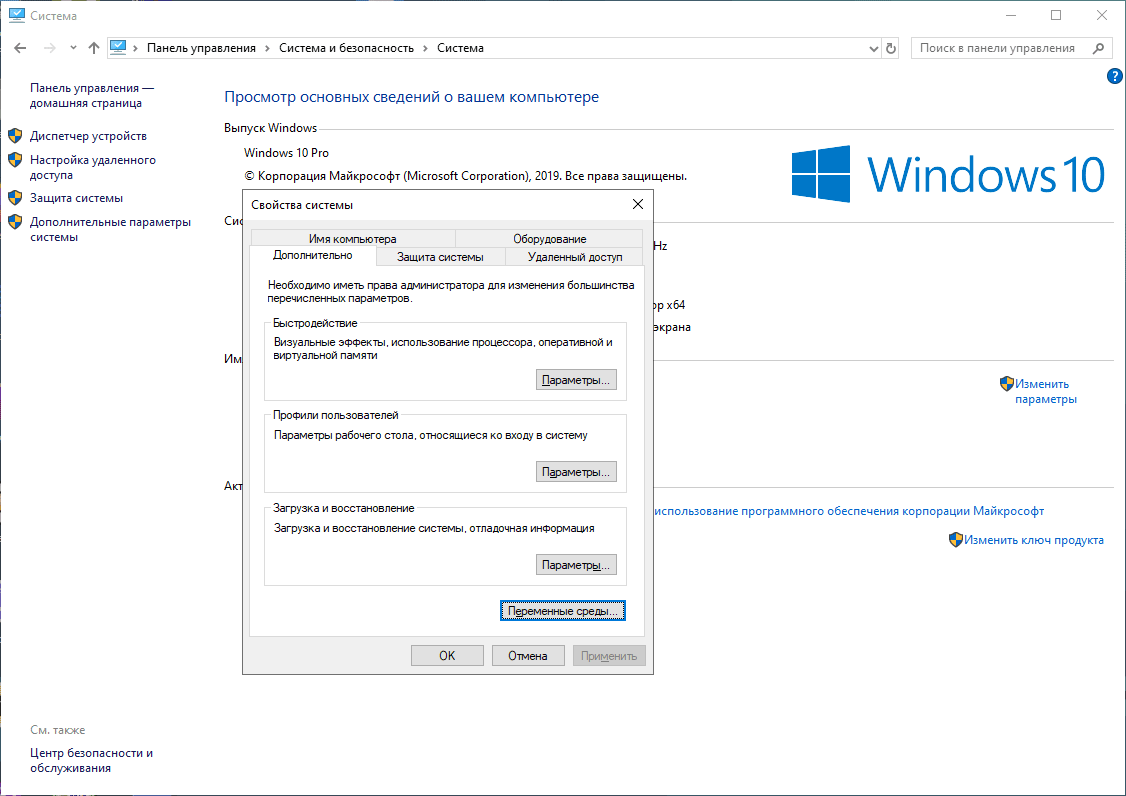
Add a new variable SSLKEYLOGFILE for the user and specify the path to the file.
As a result, we get logs with keys, the beginning of the file:
# SSL/TLS secrets log file, створений NSS
CLIENT_HANDSHAKE_TRAFFIC_SECRET 2f80c7dfd9f1bd5f4cf0084b9c814006178a06b820c5cab264f3727fac1abb23 dcfc82758fbb587e526daaab9fdc0bcaaab68e5706ba0512292dc55a627b8627
SERVER_HANDSHAKE_TRAFFIC_SECRET 2f80c7dfd9f1bd5f4cf0084b9c814006178a06b820c5cab264f3727fac1abb23 d807f4757db1f9ba8df434d8b0005d07e4987459c1d14c7ea793e4c4f5b240dc
CLIENT_TRAFFIC_SECRET_0 2f80c7dfd9f1bd5f4cf0084b9c814006178a06b820c5cab264f3727fac1abb23 40186c6b1c925c63cd57e8fa235ba9d0bf14eb29c21cbb6494ef944e1e7a4cc3
SERVER_TRAFFIC_SECRET_0 2f80c7dfd9f1bd5f4cf0084b9c814006178a06b820c5cab264f3727fac1abb23 a0a377f26a0962eceae55bec94fcd7549d9b1d5d1e9b70c45627299ca2b9b129
EXPORTER_SECRET 2f80c7dfd9f1bd5f4cf0084b9c814006178a06b820c5cab264f3727fac1abb23
...
In newer versions, after installing Windows 10, the old way of adding environment variables may no longer work. Then there is an alternative option using a PowerShell command.
Set variable:
[Environment]::SetEnvironmentVariable("PATH", "C:\TestPath", "User")
The first parameter is the variable name, the second is the value, the third is the level for which the variable is (user or system).
In our case:
[Environment]::SetEnvironmentVariable("SSLKEYLOGFILE", "D:\wireshark", "User")
# export SSLKEYLOGFILE=/Users/username/sslkeylogs/output.log
# open -a firefox
# wireshark
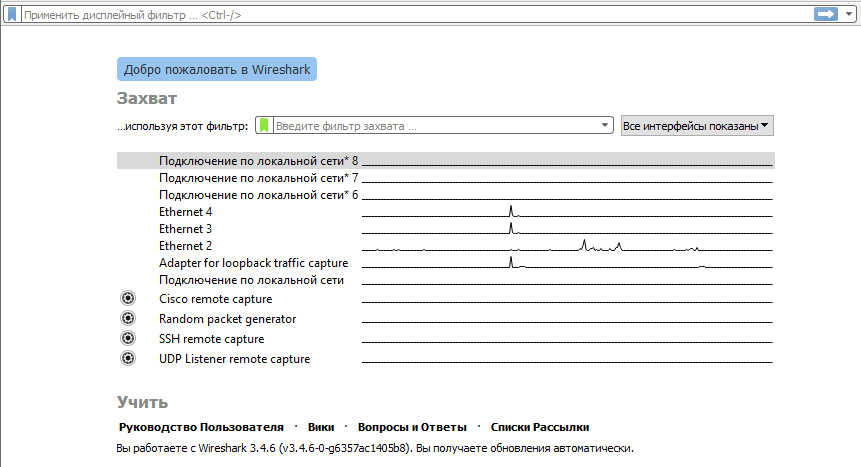
After accumulating the logs, we launch Wireshark.
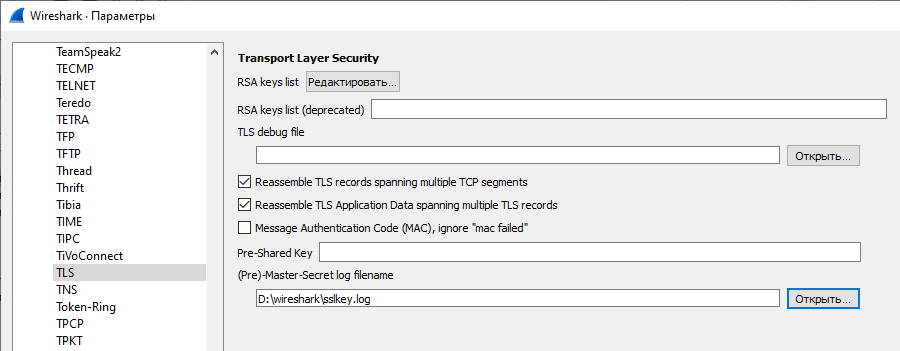
Go to “Settings”, there on the “Protocols” tab we find the TLS section (previously it was called SSL) – and specify the path to the file with the logs and the key that was used in the symmetric encryption session: (Pre)-Master-Secret log filename.
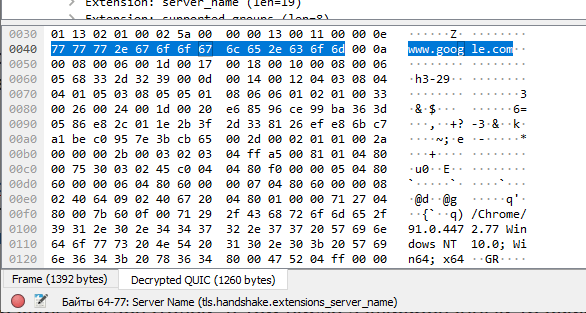
For example, when a user accesses the Gmail server, in the QUIC packet inspection window we see regular QUIC packets encrypted with a TLS key.
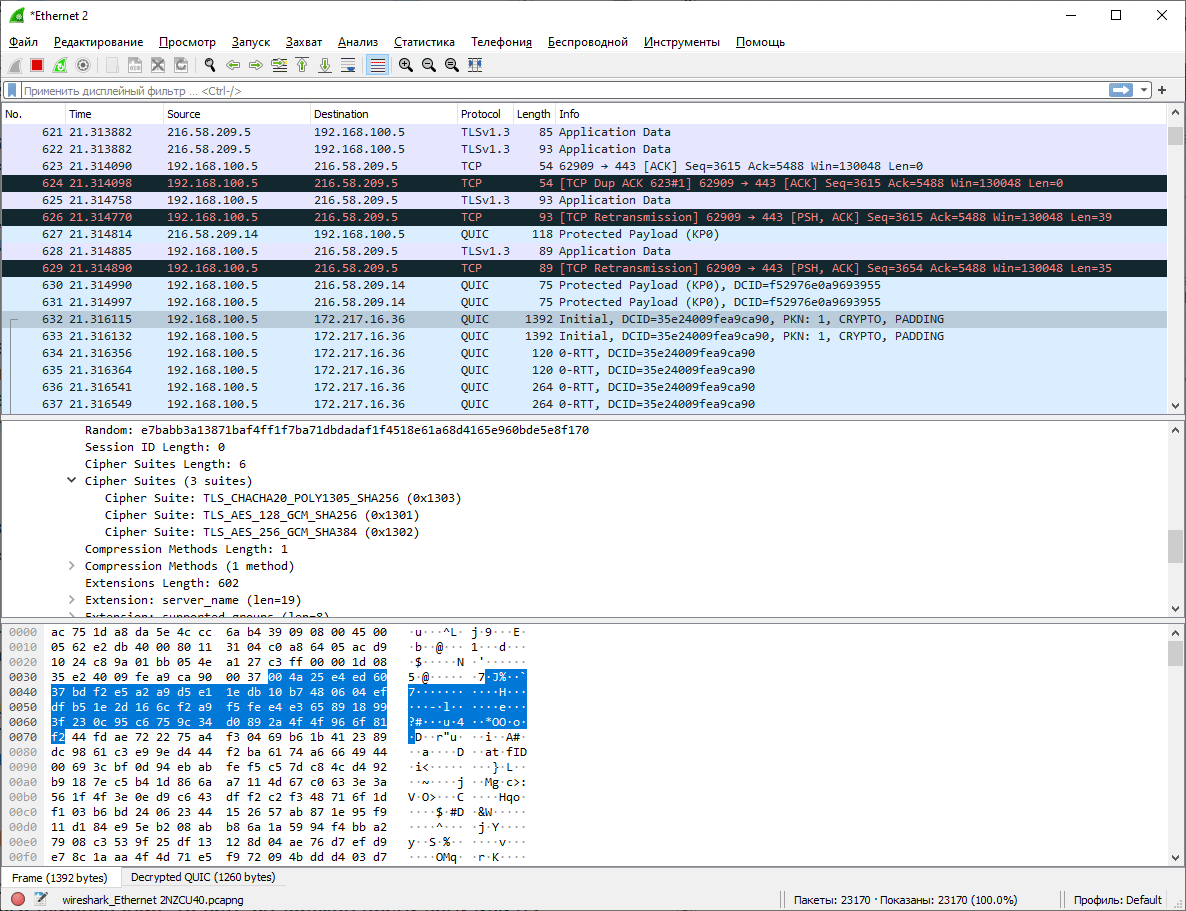
But a new tab, Decrypted QUIC, appears at the bottom of the screen, showing the decrypted contents of these packets.
This method of decrypting client traffic does not require the installation of Wireshark on the user’s device – it is enough to get a dump with keys, and then use it together with the traffic dump for analysis.
According to current legislation, providers must store user traffic, including encrypted TLS/SSL. Thanks to this, it is clear how its decryption can take place: only session keys for symmetric encryption are needed.
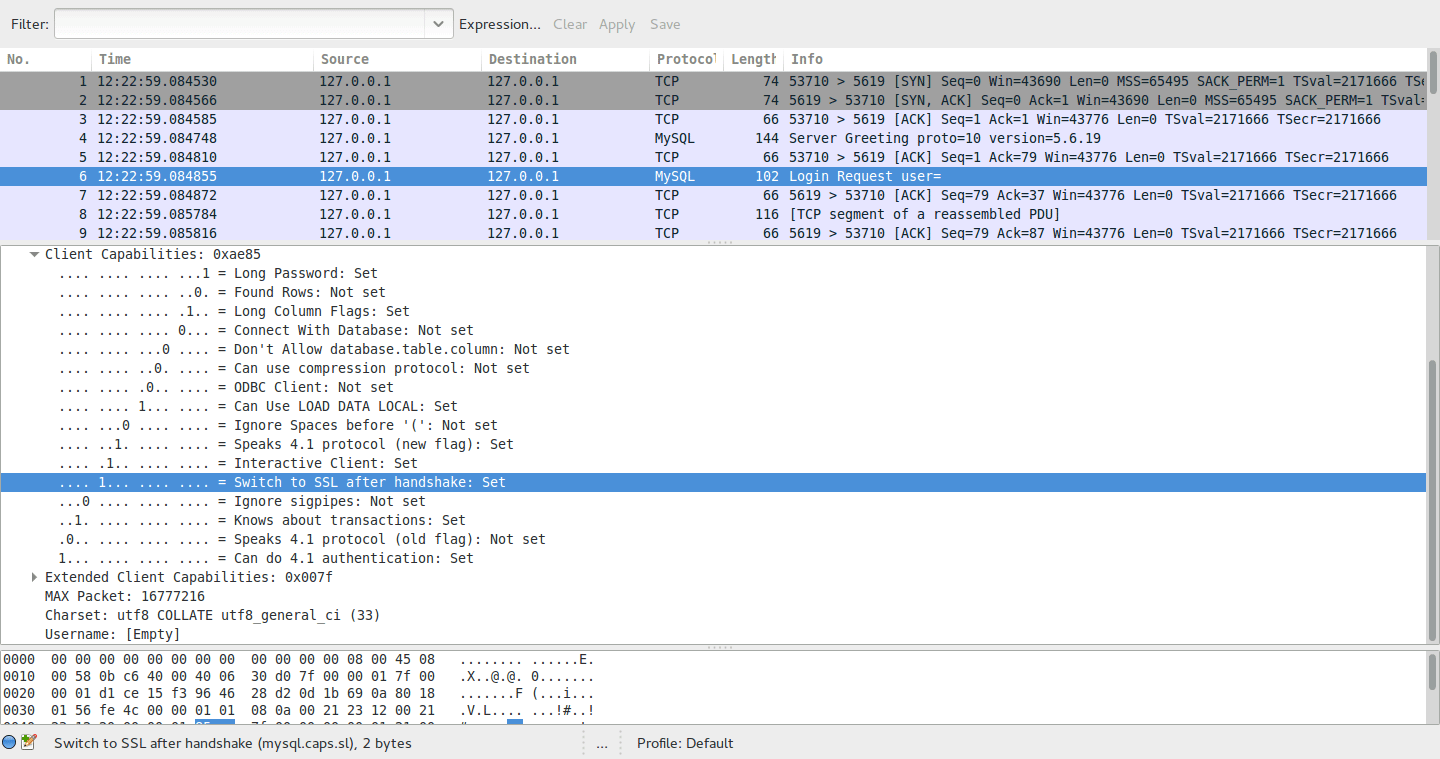
Note: This method is not limited to HTTP. It is also possible to intercept and decrypt SSL/TLS traffic in other streams. For example, encrypted traffic from a MySQL server.
If you need to understand the server in production, it is convenient to copy the pcap files from there – and analyze the traffic on your own computer.
We record packets on the server using the tcpdump packet sniffer, which is included in the standard *nix package:
tcpdump port 443 -w output.pcap
Then copy the files to your computer:
scp host:~/output.pcap
Here we launch Wireshark and open the resulting file.
There is an option to monitor server traffic in real time from your home computer. For example, all traffic except ports 22 and 53:
ssh root@host tcpdump -U -s0 'not port 22 and not port 53' -w - | wireshark -k -I -
Approximately the same from a Windows computer:
plink.exe -ssh -pw password root@host "tcpdump -ni eth0 -s 0 -w - not port 22" | "C:\Program Files\Wireshark\Wireshark.exe" -k -i -
To select a specific TCP connection, you need to find the desired packet, right-click on it, and apply a filter via the dialog menu.
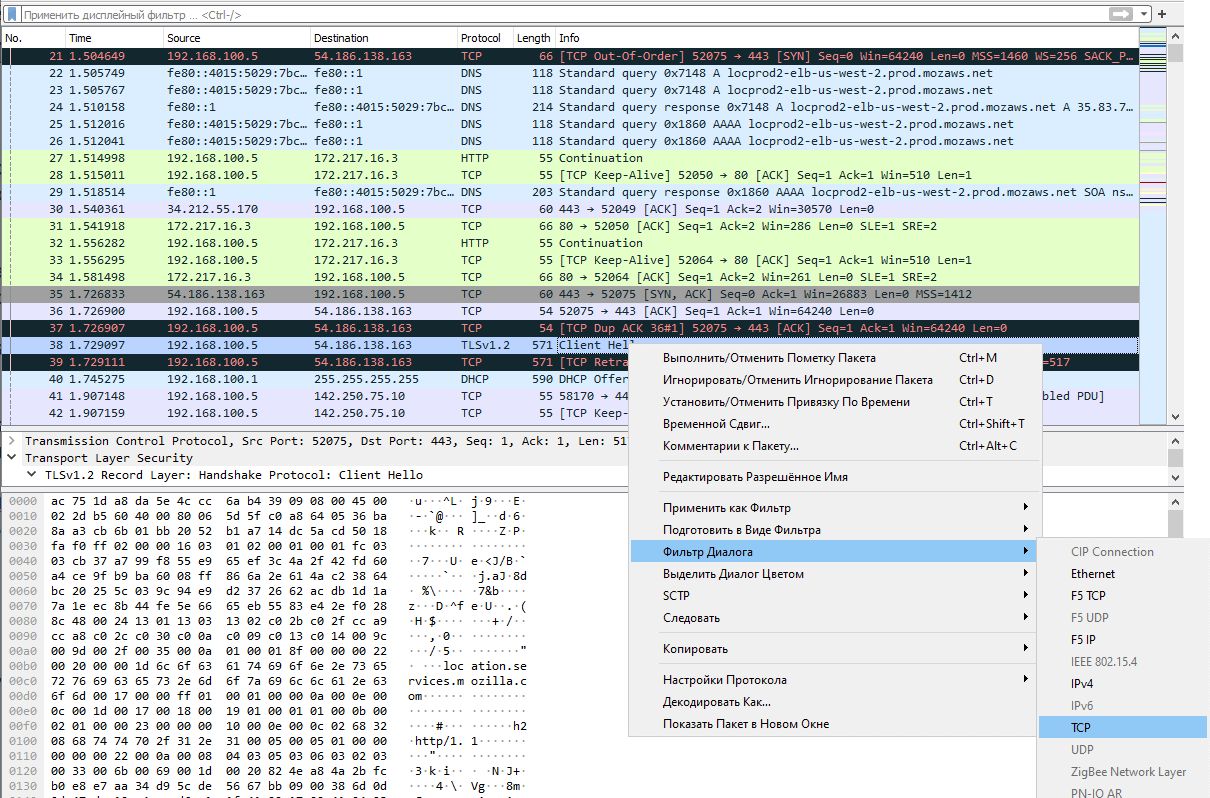
Now, of all the recorded traffic, only the packets belonging to this particular connection remain.
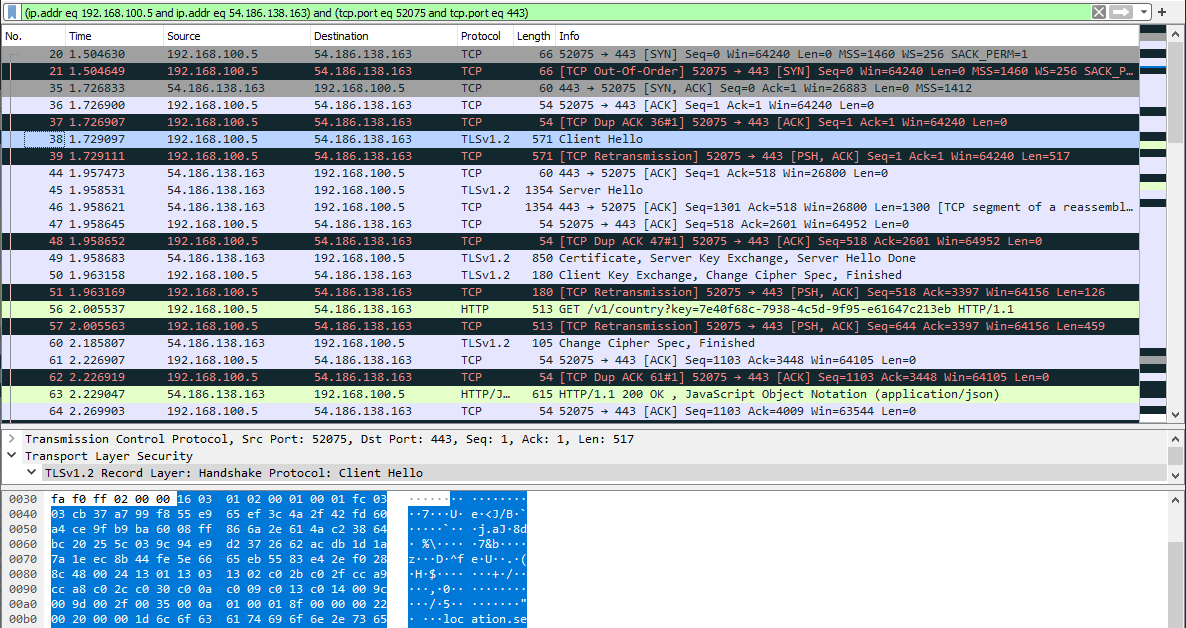
The screenshot shows the packets from the moment the TLS connection was established: client greeting, server greeting response, certificate, list of available ciphers, etc. The contents of each packet can be viewed in detail separately, which is very convenient for analysis.
Wireshark is usually used to diagnose specific problems. For example, if a TLS connection is broken, you can check who initiated its termination (client or server), at what stage it happened, and what the reason might have been.
Byte-by-byte packet analysis in Wireshark is a real godsend for detecting critical errors. Thanks to this feature, it was possible to uncover a serious bug in Intel 82574L Gigabit Ethernet controllers. It turned out that these controllers can completely disconnect in response to a specially crafted “death packet” – a packet with a certain sequence of bytes.
Thanks to Wireshark, it was possible to determine that the network interface is disconnected when the value 2 or 3 (32 or 33 in hexadecimal format) is located at address 0x47f. If the value is 4, everything works fine.
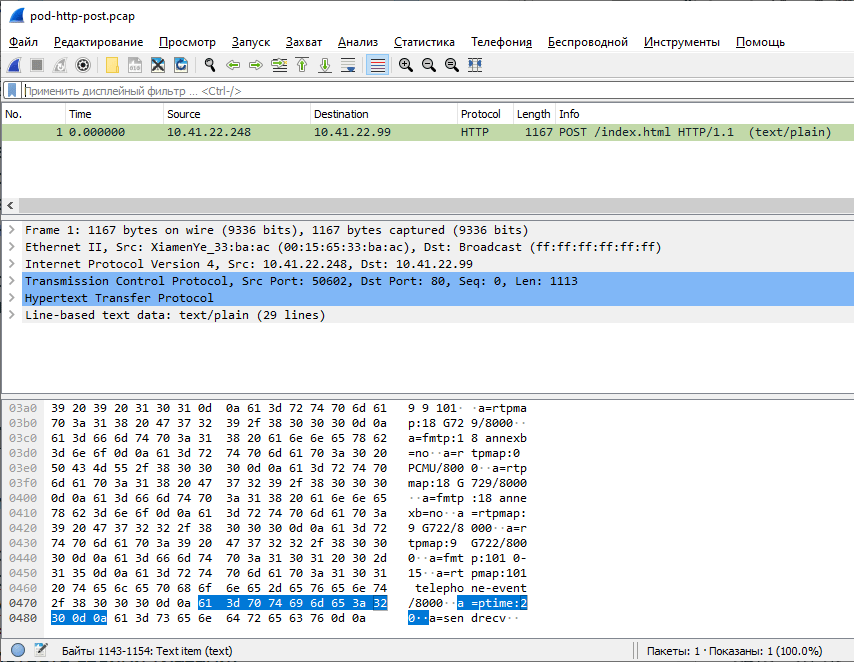
For a detailed study, you can download the files pod-http-post.pcap and pod-icmp-ping.pcap, open them in Wireshark and view the contents of the packets yourself. This is a great example of how Wireshark helps to find and eliminate the most subtle problems in network protocols and equipment.
Almost any type of packet was suitable for such an attack: it could be both an HTTP POST request and an ICMP echo-request. For example, it was possible to configure a web server so that it returned a response with a code of 200 and a special sequence of bytes that “turned off” the network interfaces on client devices. The situation is really quite unusual and interesting, since it allowed to remotely disable network equipment using a regular network packet.
Above we used a dialog filter to output all packets for a specific TCP connection. However, filters can also be written manually. Here are some example queries:
frame contains “google”— search for all packets with the word “google” anywhere in the packet
tcp.port == 443- Port 443
dns.resp.len > 0- all DNS responses
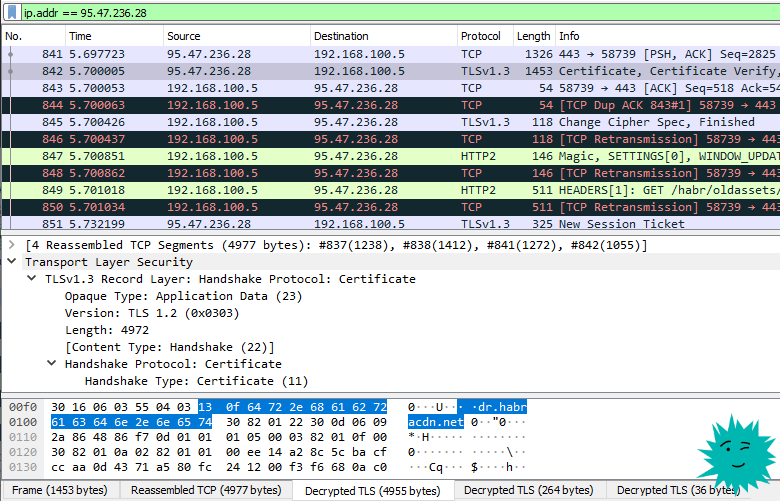
ip.addr == 95.47.236.28— specific IP address for the recipient or sender
The filters are much richer than in tcpdump, so it is better to do traffic analysis in Wireshark.
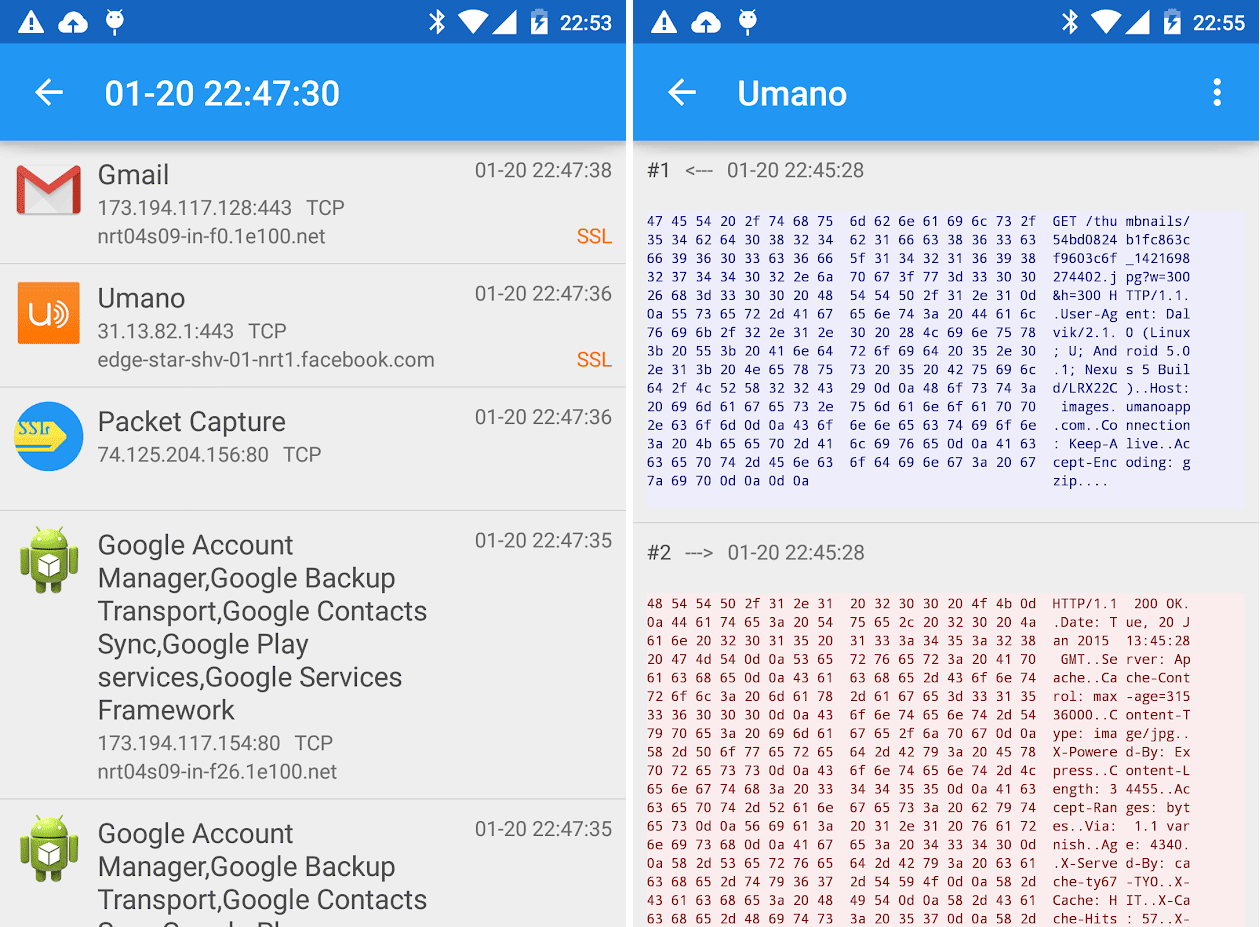
Similarly, you can analyze traffic from fitness watches via Bluetooth or the traffic of any mobile application on Android. To do this, it is enough to record packets in PCAP format directly on the mobile device, and then transfer them to a computer for detailed analysis in Wireshark. This approach allows you to study the interaction of applications with the server, inspect data transfer and identify potential vulnerabilities.
There are several mobile apps for PCAP recording. For example, the PCAPdroid app for Android:
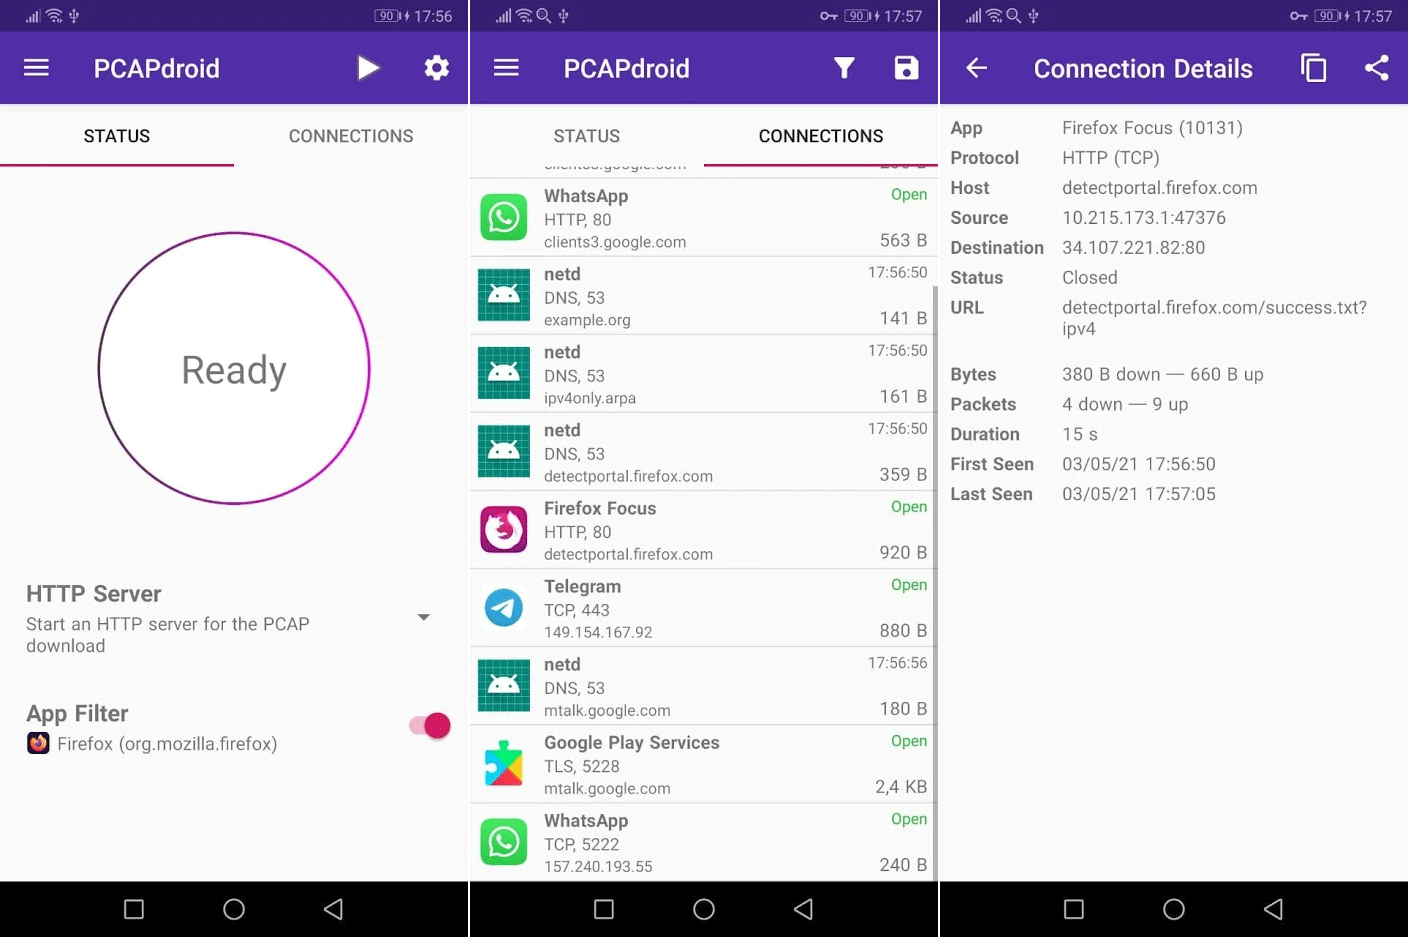
Actually, transferring PCAP files to a computer is not necessary – they can be analyzed directly on a mobile device. Some mobile sniffers already have basic functions for packet analysis. For example, the Packet Capture and Termux programs allow you not only to record traffic, but also to view its structure directly on a smartphone. This is convenient for quick diagnostics and analysis of network connections in the field.
Wireshark also has a direct Androiddump interface to capture data from the phone directly via the Android SDK.
To analyze traffic from your TV, your wife’s smartphone, or other devices on your home network connected via Ethernet or Wi-Fi, you need to record PCAP files directly on your router. In many cases, this can be accomplished using the router’s built-in tools. One of the most common tools for this is tcpdump, a utility that allows you to capture network packets directly on your router.
ssh [email protected] -c "tcpdump -v -w - -i eth2" > mypackets.pcap
For OpenWrt firmware, there is an option to mirror traffic using iptables-mod-tee.
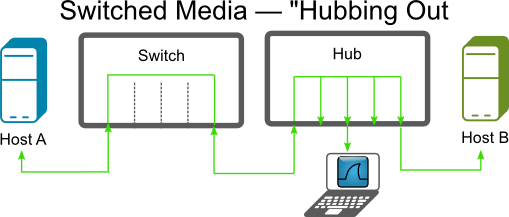
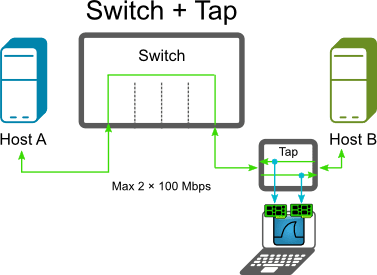
You can mirror and record traffic using an additional physical hub or by tapping into the network. For more information, see the documentation.
Another approach is to intercept wireless Wi-Fi traffic using the Airodump-ng utility, which allows you to work without access to the router. This method is better suited for analyzing traffic on third-party hotspots.
Then everything is simple: load the resulting files into Wireshark, configure the necessary filters and perform the analysis.
By the way, Wireshark supports not only network traffic, but also USB traffic analysis. To do this, you can use the built-in USBPcap sniffer or import packets from other utilities, such as Npcap or RawCap. This opens up additional opportunities for studying the interaction of various devices with a computer.
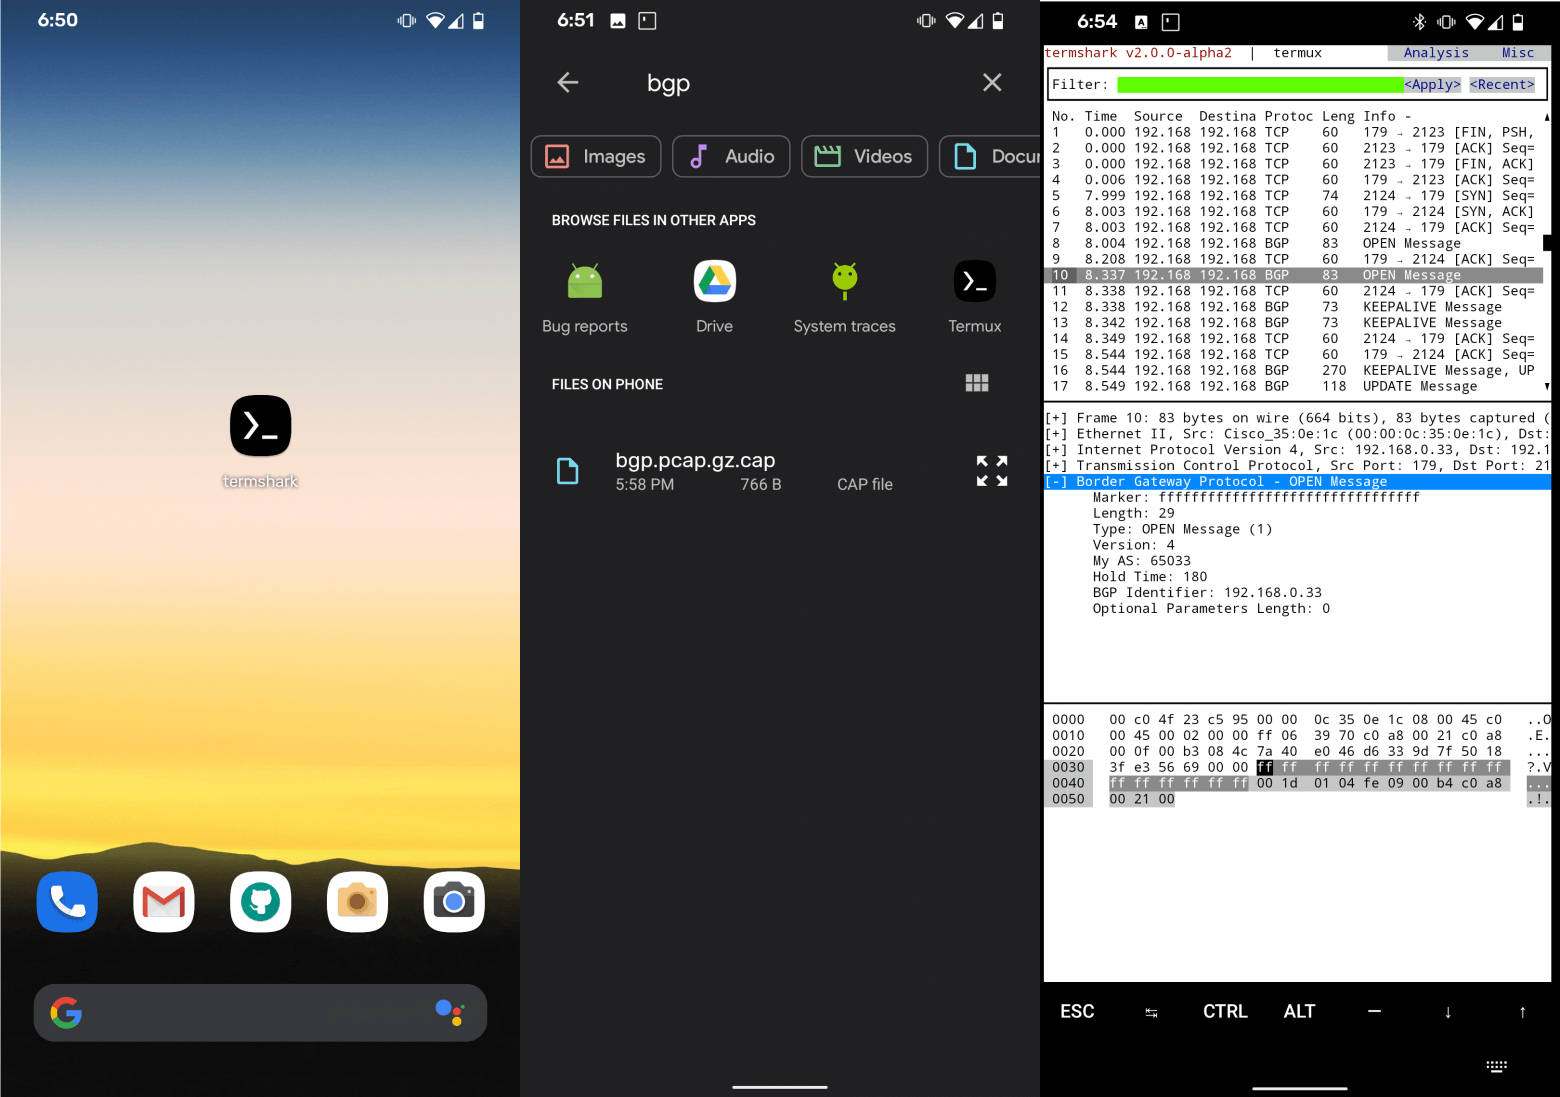
If you are working with large logs on a remote server and do not want to transfer all the data to your computer, you will find Termshark useful – it is a console interface for TShark, which resembles Wireshark in appearance. Termshark allows you to perform packet analysis directly on the server, saving resources and time. Thanks to the convenient console interface, you can quickly view packets, apply filters and perform detailed analysis without the need for a graphical environment.
Read pcap files and listen to traffic from active interfaces in real time (where tshark is enabled)
Filtering pcap or active interfaces using Wireshark display filters
Reassemble and inspect TCP and UDP streams
View network sessions by protocol
Copy selected packets from the console to the clipboard
The tool is written in Go, and compiles to a single executable file on each platform: there are pre-built versions for Linux, macOS, BSD variants, Android (termux), and Windows.
Here’s what the Android version looks like:
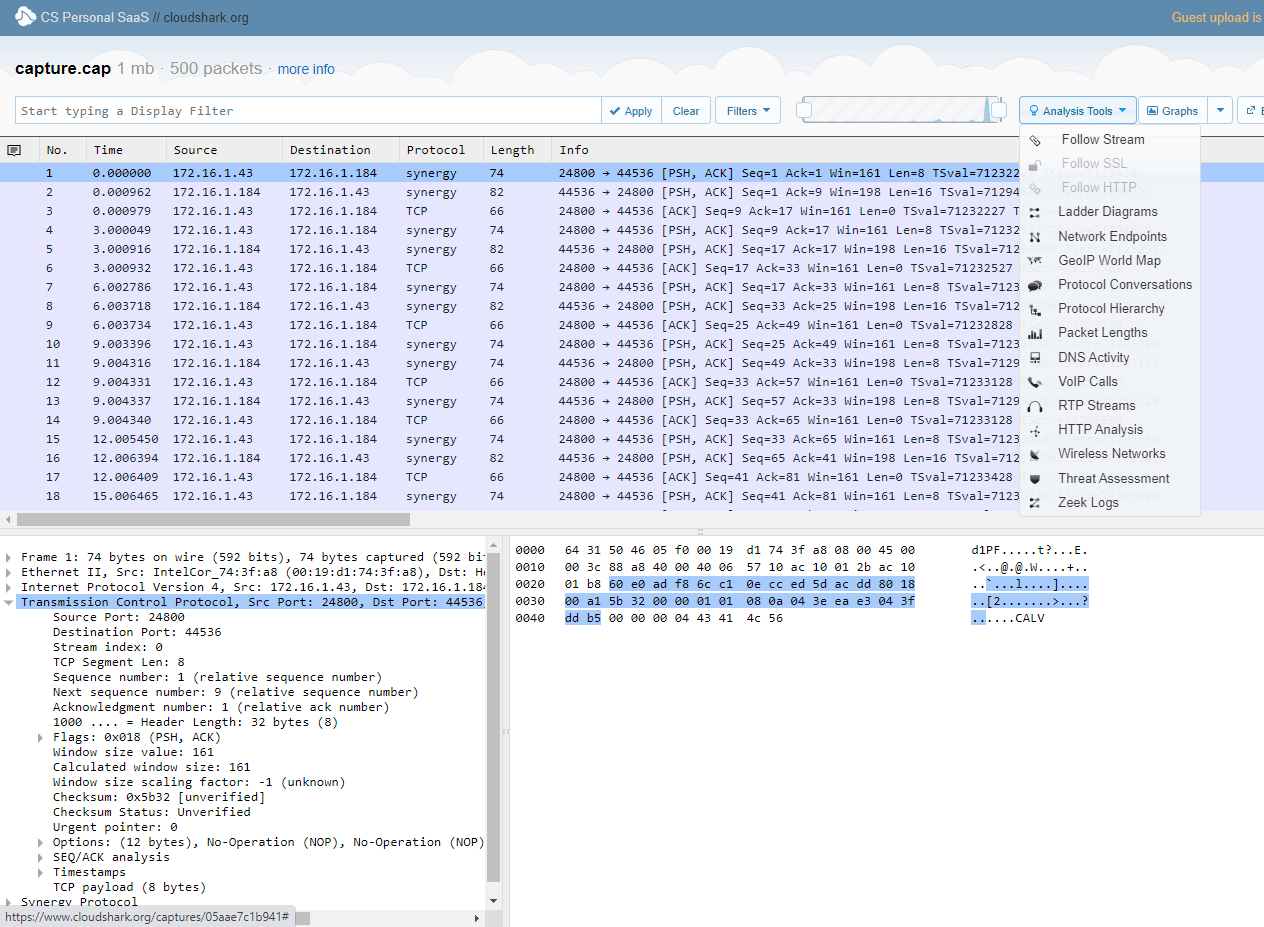
If for some reason you can’t run Wireshark on your computer, you should try the CloudShark cloud service, which is pleasantly surprising in its quality. Its main advantage is the ability to collaborate and publish packet parses via URL. For example, public parses are available at cloudshark.org/captures/05aae7c1b941. Files are uploaded to the cloud and analyzed directly in the browser.
This approach will come in handy if you need to ask for advice on a forum, share the analysis with colleagues, or publish the traffic analysis for public access. This is especially convenient for mobile devices, because there are packet interception tools for Android, but there are no full-fledged analyzers. CloudShark works on a subscription basis, but offers a 30-day trial period.
Overall, Wireshark is an incredible tool for any network-related task. In addition to its huge practical benefits, it provides a great insight into how ISPs’ DPI filtering systems work, as the principles of their operation are largely similar.